. 2011 Nov;85(22):11891-900.
doi: 10.1128/JVI.00832-11. Epub 2011 Aug 31.

Role of peroxisome proliferator-activated receptor gamma coactivator 1alpha in AKT/PKB-mediated inhibition of hepatitis B virus biosynthesis

Affiliations

Role of peroxisome proliferator-activated receptor gamma coactivator 1alpha in AKT/PKB-mediated inhibition of hepatitis B virus biosynthesis

Caitlin R Ondracek et al. J Virol. 2011 Nov.

Abstract

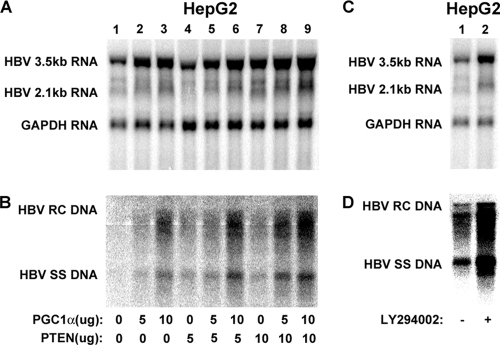
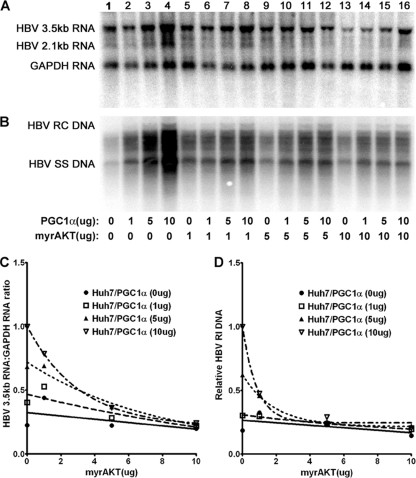
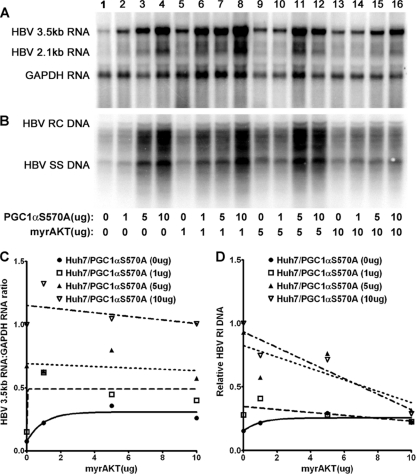
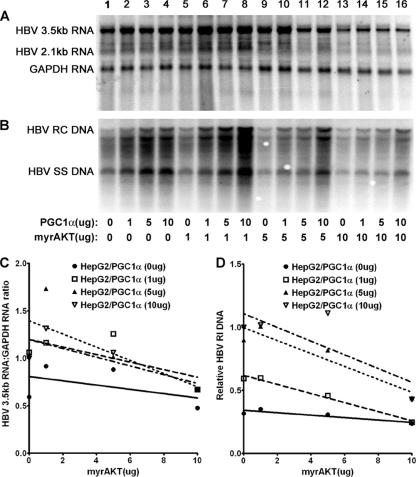
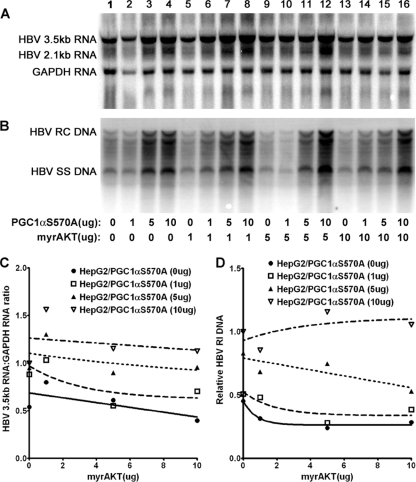
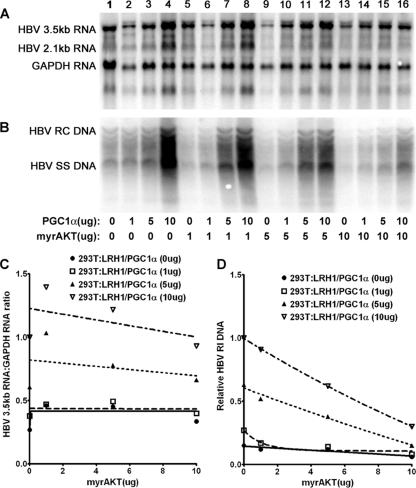
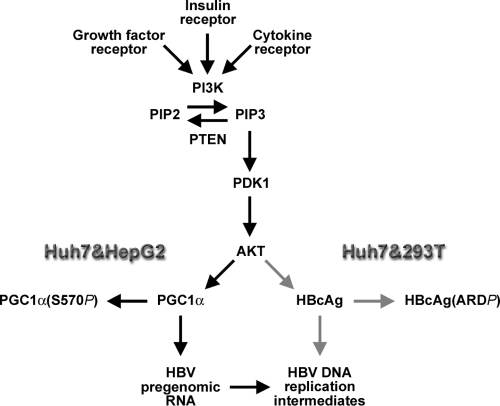
Hepatitis B virus (HBV) transcription and replication are essentially restricted to hepatocytes because liver-enriched transcription factors govern viral RNA synthesis. The level of transcription from the HBV promoters depends on both the transcription factors binding to these regulatory sequence elements and their ability to recruit coactivators capable of mediating assembly of the transcription preinitiation complex containing RNA polymerase II. Nuclear receptors are a primary determinant of HBV pregenomic RNA synthesis and, hence, viral replication. Peroxisome proliferator-activated receptor γ coactivator 1α (PGC1α) enhances the activity of nuclear receptors and, consequently, HBV biosynthesis. PGC1α is also an important target of signal transduction pathways involved in hepatic glucose and lipid homeostasis, suggesting that this coactivator may have an important role in modulating HBV biosynthesis under various physiological conditions. Consistent with this suggestion, v-akt murine thymoma viral oncogene homolog/protein kinase B (AKT/PKB) is shown to modulate PGC1α activity and, hence, HBV transcription and replication in a cell line-specific manner. In addition, AKT can modulate HBV replication in some but not all cell lines at a posttranscriptional step in the viral life cycle. These observations demonstrate that growth and nutritional signals have the capacity to influence viral production, but the magnitude of these effects will depend on the precise cellular context in which they occur.


Figures

Fig. 1.
Fig. 1.
Effect of PTEN/PI3K/PDK1/AKT signal transduction pathway on HBV biosynthesis in the human hepatoma cell line HepG2. (A and B) Cells were transfected with the HBV DNA (4.1-kbp) construct alone (lane 1) or the HBV DNA (4.1-kbp) construct plus the PGC1α and PTEN expression vectors (lanes 2 to 9), as indicated. (C and D) Cells were treated with the PI3K inhibitor LY294002 (10 μM), as indicated. (A and C) RNA (Northern) filter hybridization analysis of HBV transcripts. The glyceraldehyde-3-phosphate dehydrogenase (GAPDH) transcript was used as an internal control for RNA loading per lane. (B and D) DNA (Southern) filter hybridization analysis of HBV replication intermediates. HBV RC DNA, HBV relaxed circular DNA; HBV SS DNA, HBV single-stranded DNA.
Fig. 2.
Fig. 2.
Effect of PGC1α and AKT expression on HBV biosynthesis in the human hepatoma cell line Huh7. Cells were transfected with the HBV DNA (4.1-kbp) construct alone (lane 1) or the HBV DNA (4.1-kbp) construct plus the PGC1α and AKT expression vectors (lanes 2 to 16), as indicated. (A) RNA (Northern) filter hybridization analysis of HBV transcripts. The glyceraldehyde-3-phosphate dehydrogenase (GAPDH) transcript was used as an internal control for RNA loading per lane. (B) DNA (Southern) filter hybridization analysis of HBV replication intermediates. HBV RC DNA, HBV relaxed circular DNA; HBV SS DNA, HBV single-stranded DNA. (C) Quantitative analysis of the HBV 3.5-kb RNA from two independent experiments. Trend lines were calculated using one-phase decay analysis and the method of least-squares fit (GraphPad Prism, version 5, software). (D) Quantitative analysis of the HBV replication intermediates from two independent experiments. Trend lines were calculated using one-phase decay analysis and the method of least-squares fit (GraphPad Prism, version 5, software).
Fig. 3.
Fig. 3.
Effect of PGC1αS570A and AKT expression on HBV biosynthesis in the human hepatoma cell line Huh7. Cells were transfected with the HBV DNA (4.1-kbp) construct alone (lane 1) or the HBV DNA (4.1-kbp) construct plus the PGC1αS570A and AKT expression vectors (lanes 2 to 16), as indicated. (A) RNA (Northern) filter hybridization analysis of HBV transcripts. The glyceraldehyde-3-phosphate dehydrogenase (GAPDH) transcript was used as an internal control for RNA loading per lane. (B) DNA (Southern) filter hybridization analysis of HBV replication intermediates. HBV RC DNA, HBV relaxed circular DNA; HBV SS DNA, HBV single-stranded DNA. (C) Quantitative analysis of the HBV 3.5-kb RNA from three independent experiments. Trend lines were calculated using one-phase decay analysis and the method of least-squares fit (GraphPad Prism, version 5, software). (D) Quantitative analysis of the HBV replication intermediates from three independent experiments. Trend lines were calculated using one-phase decay analysis and the method of least-squares fit (GraphPad Prism, version 5, software).
Fig. 4.
Fig. 4.
Effect of PGC1α and AKT expression on HBV biosynthesis in the human hepatoma cell line HepG2. Cells were transfected with the HBV DNA (4.1-kbp) construct alone (lane 1) or the HBV DNA (4.1-kbp) construct plus the PGC1α and AKT expression vectors (lanes 2 to 16), as indicated. (A) RNA (Northern) filter hybridization analysis of HBV transcripts. The glyceraldehyde-3-phosphate dehydrogenase (GAPDH) transcript was used as an internal control for RNA loading per lane. (B) DNA (Southern) filter hybridization analysis of HBV replication intermediates. HBV RC DNA, HBV relaxed circular DNA; HBV SS DNA, HBV single-stranded DNA. (C) Quantitative analysis of the HBV 3.5-kb RNA from four independent experiments. Trend lines were calculated using one-phase decay analysis and the method of least-squares fit (GraphPad Prism, version 5, software). (D) Quantitative analysis of the HBV replication intermediates from four independent experiments. Trend lines were calculated using one-phase decay analysis and the method of least-squares fit (GraphPad Prism, version 5, software).
Fig. 5.
Fig. 5.
Effect of PGC1αS570A and AKT expression on HBV biosynthesis in the human hepatoma cell line HepG2. Cells were transfected with the HBV DNA (4.1-kbp) construct alone (lane 1) or the HBV DNA (4.1-kbp) construct plus the PGC1αS570A and AKT expression vectors (lanes 2 to 16), as indicated. (A) RNA (Northern) filter hybridization analysis of HBV transcripts. The glyceraldehyde-3-phosphate dehydrogenase (GAPDH) transcript was used as an internal control for RNA loading per lane. (B) DNA (Southern) filter hybridization analysis of HBV replication intermediates. HBV RC DNA, HBV relaxed circular DNA; HBV SS DNA, HBV single-stranded DNA. (C) Quantitative analysis of the HBV 3.5-kb RNA from two independent experiments. Trend lines were calculated using one-phase decay analysis and the method of least-squares fit (GraphPad Prism, version 5, software). (D) Quantitative analysis of the HBV replication intermediates from two independent experiments. Trend lines were calculated using one-phase decay analysis and the method of least-squares fit (GraphPad Prism, version 5, software).
Fig. 6.
Fig. 6.
Effect of PGC1α and AKT expression on HBV biosynthesis in the human embryonic kidney cell line 293T. Cells were transfected with the HBV DNA (4.1-kbp) construct and the LRH1 expression vector (lane 1) or the HBV DNA (4.1-kbp) construct and the LRH1 expression vector plus the PGC1α and AKT expression vectors (lanes 2 to 16), as indicated. (A) RNA (Northern) filter hybridization analysis of HBV transcripts. The glyceraldehyde-3-phosphate dehydrogenase (GAPDH) transcript was used as an internal control for RNA loading per lane. (B) DNA (Southern) filter hybridization analysis of HBV replication intermediates. HBV RC DNA, HBV relaxed circular DNA; HBV SS DNA, HBV single-stranded DNA. (C) Quantitative analysis of the HBV 3.5-kb RNA from two independent experiments. Trend lines were calculated using one-phase decay analysis and the method of least-squares fit (GraphPad, version 5, software). (D) Quantitative analysis of the HBV replication intermediates from two independent experiments. Trend lines were calculated using one-phase decay analysis and the method of least-squares fit (GraphPad Prism, version 5, software).
Fig. 7.
Fig. 7.
Effect of PGC1αS570A and AKT expression on HBV biosynthesis in the human embryonic kidney cell line 293T. Cells were transfected with the HBV DNA (4.1-kbp) construct and the LRH1 expression vector (lane 1) or the HBV DNA (4.1-kbp) construct and the LRH1 expression vector plus the PGC1αS570A and AKT expression vectors (lanes 2 to 16), as indicated. (A) RNA (Northern) filter hybridization analysis of HBV transcripts. The glyceraldehyde-3-phosphate dehydrogenase (GAPDH) transcript was used as an internal control for RNA loading per lane. (B) DNA (Southern) filter hybridization analysis of HBV replication intermediates. HBV RC DNA, HBV relaxed circular DNA; HBV SS DNA, HBV single-stranded DNA. (C) Quantitative analysis of the HBV 3.5-kb RNA from three independent experiments. Trend lines were calculated using one-phase decay analysis and the method of least-squares fit (GraphPad Prism, version 5, software). (D) Quantitative analysis of the HBV replication intermediates from three independent experiments. Trend lines were calculated using one-phase decay analysis and the method of least-squares fit (GraphPad Prism, version 5, software).
Fig. 8.
Fig. 8.
Signal transduction pathways potentially modulating HBV transcription and replication in HBV-infected hepatocytes. Growth factors, hormones, and cytokines may modulate the phosphatase and tensin homolog (PTEN)/phosphatidylinositol 3-kinase (PI3K)/phosphoinositide-dependent kinase-1 (PDK1)/AKT signal transduction pathway. PTEN converts phosphatidylinositol 3,4,5-trisphosphate (PIP3) to phosphatidylinositol 4,5-bisphosphate (PIP2). PI3K converts PIP2 to PIP3. PIP3 activates PDK1 and AKT (5, 28). AKT is known to phosphorylate PGC1α on serine 570, leading to reduced transcriptional activity on known target genes (23), including the HBV nucleocapsid gene (black arrows), as observed in Huh7 and HepG2 cells. In addition, AKT can directly or indirectly inhibit HBV replication in Huh7 and 293T cells at a posttranscriptional step in the viral replication cycle potentially involving phosphorylation of the HBV nucleocapsid polypeptide (HBcAg) in the arginine-rich carboxyl-terminal domain (ARD) (gray arrows).

Similar articles

Cited by

References

    1. Beasley R. P. 1988. Hepatitis B virus: the major etiology of hepatocellular carcinoma. Cancer 61: 1942–1956 - PubMed
    1. Beasley R. P., Hwang L.-Y., Lin C.-C., Chien C.-S. 1981. Hepatocellular carcinoma and hepatitis B virus—a prospective study of 22707 men in Taiwan. Lancet ii: 1129–1133 - PubMed
    1. Bhaskar P. T., Hay N. 2007. The two TORCs and Akt. Dev. Cell 12: 487–502 - PubMed
    1. Boyault S., et al. 2007. Transcriptome classification of HCC is related to gene alterations and to new therapeutic targets. Hepatology (Baltimore, Md.) 45: 42–52 - PubMed
    1. Cantley L. C., Neel B. G. 1999. New insights into tumor suppression: PTEN suppresses tumor formation by restraining the phosphoinositide 3-kinase/AKT pathway. Proc. Natl. Acad. Sci. U. S. A. 96: 4240–4245 - PMC - PubMed

Publication types

MeSH terms

Substances

LinkOut - more resources