. 2011 Nov;85(21):11422-34.
doi: 10.1128/JVI.05608-11. Epub 2011 Aug 31.

Increased frequency of regulatory T cells accompanies increased immune activation in rectal mucosae of HIV-positive noncontrollers

Affiliations

Increased frequency of regulatory T cells accompanies increased immune activation in rectal mucosae of HIV-positive noncontrollers

Julia M Shaw et al. J Virol. 2011 Nov.

Abstract

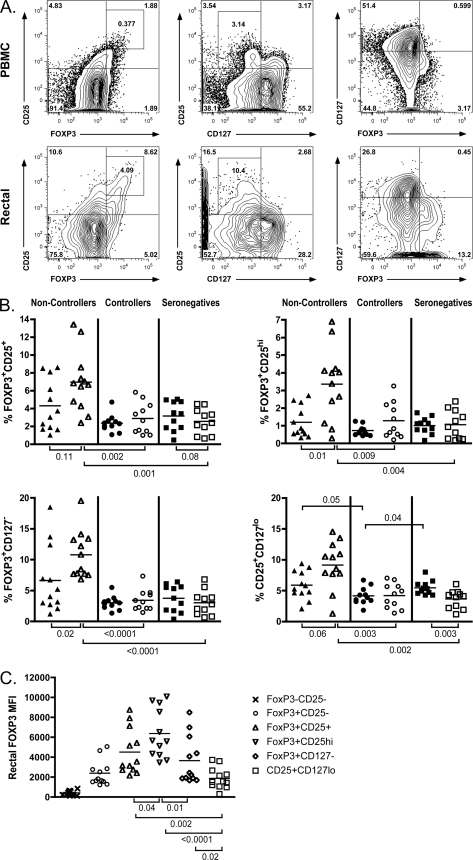
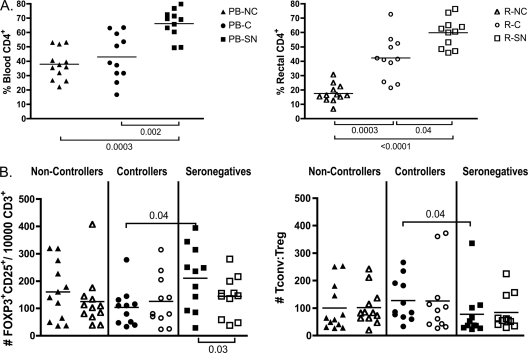
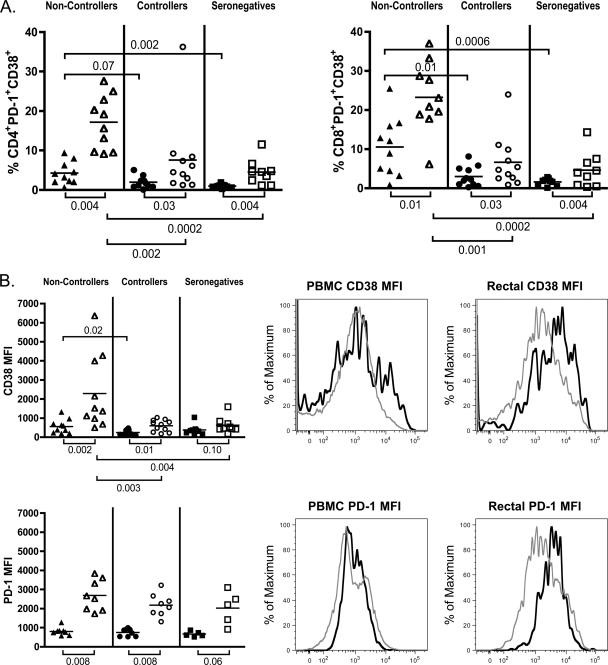
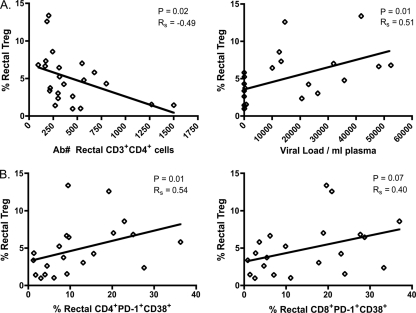
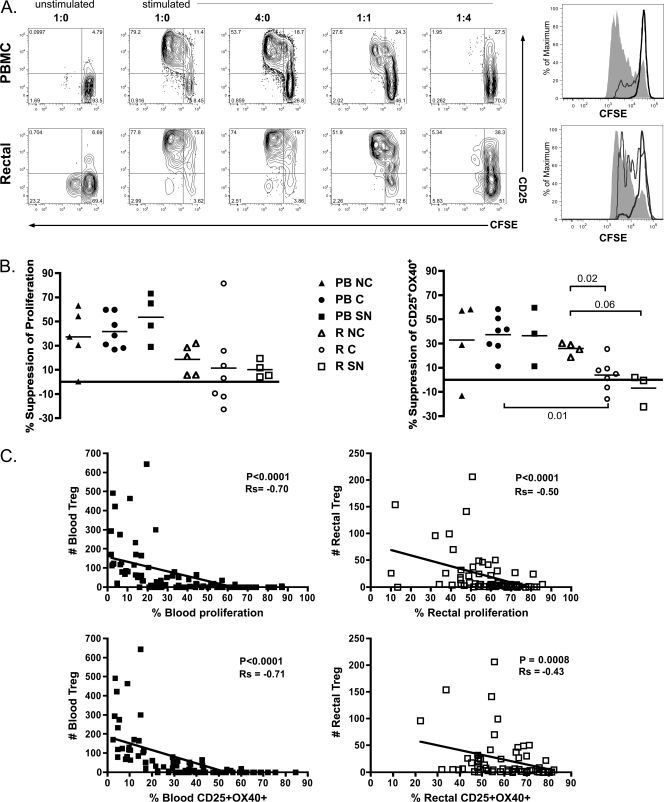
Gut-associated lymphoid tissue (GALT) is a major site of HIV replication and CD4(+) T cell depletion. Furthermore, microbial translocation facilitated by mucosal damage likely contributes to the generalized immune activation observed in HIV infection. Regulatory T cells (Treg) help maintain homeostasis and suppress harmful immune activation during infection; however, in the case of persistent viral infections such as HIV, their role is less clear. Although a number of studies have examined Treg in blood during chronic infection, few have explored Treg in the gastrointestinal mucosa. For this study, paired blood and rectal biopsy samples were obtained from 12 HIV noncontrollers (viral load of >10,000 copies/ml plasma), 10 HIV controllers (viral load of <500 copies/ml plasma for more than 5 years), and 12 HIV seronegative control subjects. Noncontrollers had significantly higher percentages of Treg in rectal mononuclear cells (RMNC), but not in blood, compared to seronegative subjects (P = 0.001) or HIV controllers (P = 0.002). Mucosal Treg positively correlated with viral load (P = 0.01) and expression of immune activation markers by CD4(+) (P = 0.01) and CD8(+) (P = 0.07) T cells. Suppression assays indicated that mucosal and peripheral Treg of noncontrollers and controllers maintained their capacity to suppress non-Treg proliferation to a similar extent as Treg from seronegative subjects. Together, these findings reveal that rather than experiencing depletion, mucosal Treg frequency is enhanced during chronic HIV infection and is positively correlated with viral load and immune activation. Moreover, mucosal Treg maintain their suppressive ability during chronic HIV infection, potentially contributing to diminished HIV-specific T cell responses and viral persistence.


Figures

Fig. 1.
Fig. 1.
Treg frequency is increased in the rectal mucosae of noncontrollers regardless of the gating strategy used to identify Treg. (A) Representative flow cytometry plots depicting four different approaches for identifying CD4+ Treg in human PBMC (top panels) and rectal cells (bottom panels) in the FOXP3+ CD25+ (left), FOXP3+ CD25hi (left, inset), CD25+ CD127lo (middle), and FOXP3+ CD127 (right) groups. Numbers within the gates represent the frequencies of the gated CD4+ subpopulations. (B) Treg frequencies in PBMC (solid symbols) and RMNC (open symbols) of noncontrollers (triangles), controllers (circles), and seronegative subjects (squares) were analyzed using the gating strategies described above. (C) FOXP3 expression in the rectal mucosae was determined by MFI and compared between each of the four Treg gating approaches. FOXP3 CD25 non-Treg and the FOXP3+ CD25 subsets were included in the analysis as reference groups. FOXP3 MFI was highest within the CD4+ FOXP3+ CD25hi and CD4+ FOXP3+ CD25+ gates. This graph contains data from the noncontroller patients; a similar pattern of expression was seen in controllers and seronegative subjects. Horizontal lines within the groups correspond to the mean. The numbers above and below the brackets are P values. P values of ≤0.05 were considered significant; P values between 1 and 0.05 were considered trends.
Fig. 2.
Fig. 2.
Numbers of CD4+ FOXP3+ CD25+ Treg are not significantly different between patient groups despite a decline in total CD4+ T cells of noncontrollers and controllers. (A and B) Treg frequencies in PBMC (PB-; solid symbols) and RMNC (R-; open symbols) of noncontrollers (NC; triangles), controllers (C; circles), and seronegative subjects (SN; squares) were determined by staining as described in Materials and Methods, and data were acquired on an LSRII flow cytometer. (A) Percentage of CD4+ T cells in the blood (left) and rectal mucosae (right). (B) The number of Treg per 10,000 CD3+ T cells was determined by dividing the number of CD4+ FOXP3+ CD25+ T cells acquired during flow cytometry sample acquisition by the total number of CD3+ T cells acquired and multiplying by 10,000 (right). The ratio of conventional T cells to Treg was determined by the following formula where the number of cells was determined by flow cytometry data: [CD8+ T cells + (CD4+ T cells − CD4+ CD25+ FOXP3+ Treg)]/CD4+ CD25+ FOXP3+ Treg (left). Horizontal lines within the groups correspond to the mean. The numbers above and below the brackets are P values. P values of ≤0.05 were considered significant; P values between 1 and 0.05 were considered trends.
Fig. 3.
Fig. 3.
Markers of T cell activation are elevated in total CD8+, CD4+, and Treg populations in the mucosae of noncontrollers. (A and B) Treg frequencies in PBMC (solid symbols) and RMNC (open symbols) of noncontrollers (triangles), controllers (circles), and seronegative subjects (squares) were stained as described in Materials and Methods, and data were acquired on an LSRII flow cytometer. Horizontal lines within the groups correspond to the mean. The numbers above and below the brackets are P values. P values of ≤0.05 were considered significant; P values between 1 and 0.05 were considered trends. (A) Coexpression of CD38 and PD-1 was used to assess T cell activation in total CD4+ (left) and CD8+ (right) T cells in the blood and rectal mucosae of the three patient groups. (B) MFI of CD38 (top panel) and PD-1 (bottom panel) in Treg populations of noncontrollers, controllers, and seronegative subjects (left). Shown are representative histograms from a noncontroller comparing MFI in CD4+ FOXP3 CD25 non-Treg (gray lines) to CD4+ FOXP3+ CD25+ Treg (black lines) for CD38 (top panels) and PD-1 (bottom panels) in the peripheral blood and rectal mucosae (right).
Fig. 4.
Fig. 4.
Mucosal Treg frequency negatively correlates with mucosal CD4 numbers and positively correlates with plasma viral load and mucosal T cell activation. (A) Relationship between rectal Treg frequencies in HIV+ subjects and mucosal CD3+ CD4+ cell number based on events acquired by flow cytometry, calculated by dividing the number of CD4+ cells by the number of live cells and multiplying by 10,000 (left) or the viral load determined by quantitative PCR (qPCR) (right). Ab#, absolute number. (B) Relationship between rectal Treg frequencies in HIV+ subjects and percentage of mucosal CD38+ PD-1+ CD4 T cells (left) or CD38+ PD-1+ CD8 T cells (right). Regression analysis was used to produce best-fit lines on all graphs, while the P values and rho values were determined using the Spearman rank test for bivariate correlations.
Fig. 5.
Fig. 5.
Peripheral and mucosal Treg of noncontrollers, controllers, and seronegative subjects are suppressive ex vivo. CD4+ CD25 non-Treg and CD4+ CD25+ Treg were separated from PBMC and RMNC using magnetic beads as described in Materials and Methods. A total of 1 × 10⁴ CFSE-labeled non-Treg were added to 96-well round-bottom plates containing 1 × 10⁵ irradiated, autologous PBMC and cultured alone or with increasing numbers of Treg. Cells were unstimulated or stimulated with 0.2 μg/ml immobilized anti-CD3 for 60 to 84 h. (A) Representative flow cytometry gating on CFSE+ cells from one experiment. Proliferation in cultures containing PBMC (top panels) or rectal cells (bottom panels) was assessed using CFSE. Contour plots show the results of cultures containing the indicated ratio of non-Treg to Treg. Histograms depict CFSE expression in non-Treg for cultures at non-Treg/Treg ratios of 1:0 (shaded areas), 1:1 (gray lines), and 1:4 (black lines). (B) Treg-mediated suppression was measured in PBMC (PB-; solid symbols) and RMNC (R-; open symbols) of noncontrollers (NC; triangles), controllers (C; circles), and seronegative subjects (SN; squares). Percent suppression was determined by dividing the level of proliferation (left) or CD25-OX40 coexpression (right) in the 1:1 cocultures by the same parameter in the 1:0 cultures, multiplying the result by 100, and subtracting this percentage from 100. Horizontal lines within boxes correspond to the mean. The numbers above and below the brackets are P values. P values of ≤0.05 were considered significant; P values between 1 and 0.05 were considered trends. (C) Graphs illustrate the relationship between FOXP3+ CD25+ Treg numbers present in PBMC (solid symbols) and RMNC (open symbols) cultures and the percent proliferation (top panels) or percent CD25-OX40 coexpression (bottom panels). Regression analysis was used to produce a best-fit line for both graphs; P values and rho values were determined using the Spearman rank test for bivariate correlations.

References

    1. Aandahl E. M., Michaelsson J., Moretto W. J., Hecht F. M., Nixon D. F. 2004. Human CD4+ CD25+ regulatory T cells control T-cell responses to human immunodeficiency virus and cytomegalovirus antigens. J. Virol. 78:2454–2459 - PMC - PubMed
    1. Allers K., et al. 2010. Gut mucosal FOXP3+ regulatory CD4+ T cells and nonregulatory CD4+ T cells are differentially affected by simian immunodeficiency virus infection in rhesus macaques. J. Virol. 84:3259–3269 - PMC - PubMed
    1. Andersson J., et al. 2005. The prevalence of regulatory T cells in lymphoid tissue is correlated with viral load in HIV-infected patients. J. Immunol. 174:3143–3147 - PubMed
    1. Antons A. K., Wang R., Kalams S. A., Unutmaz D. 2008. Suppression of HIV-specific and allogeneic T cell activation by human regulatory T cells is dependent on the strength of signals. PLoS One 3:e2952. - PMC - PubMed
    1. Baecher-Allan C., Brown J. A., Freeman G. J., Hafler D. A. 2001. CD4+CD25high regulatory cells in human peripheral blood. J. Immunol. 167:1245–1253 - PubMed

Publication types

MeSH terms