. 2011 Oct;21(10):1616-25.
doi: 10.1101/gr.122705.111. Epub 2011 Aug 31.

The human gut virome: inter-individual variation and dynamic response to diet

Affiliations

The human gut virome: inter-individual variation and dynamic response to diet

Samuel Minot et al. Genome Res. 2011 Oct.

Abstract

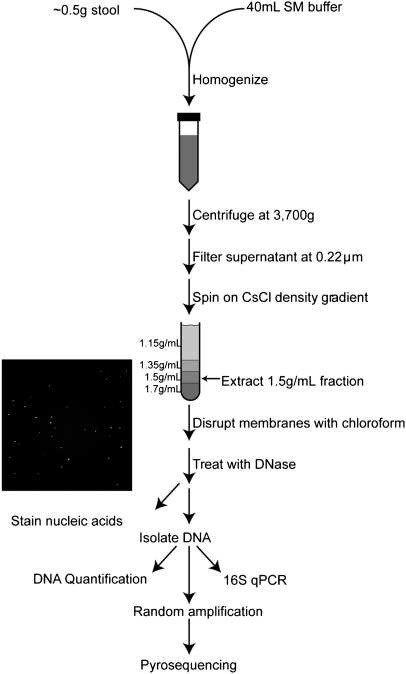
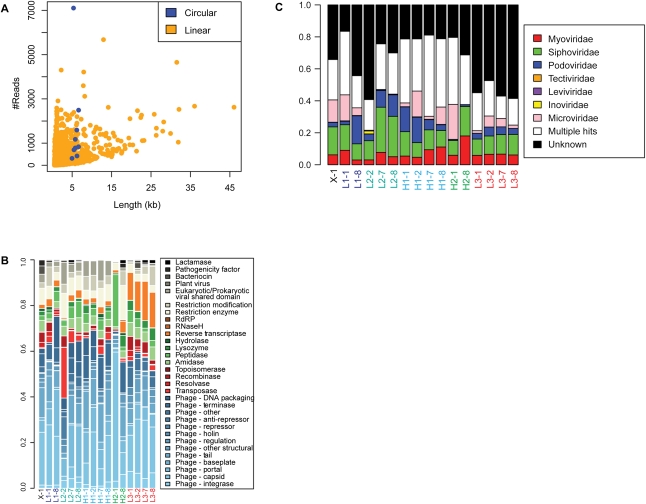
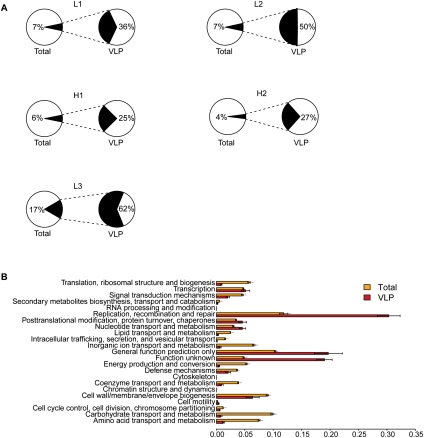
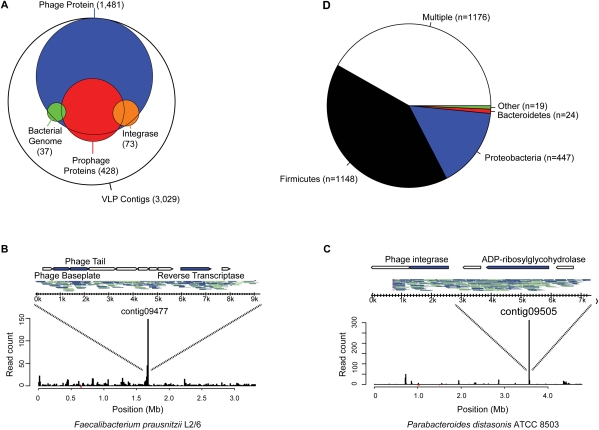
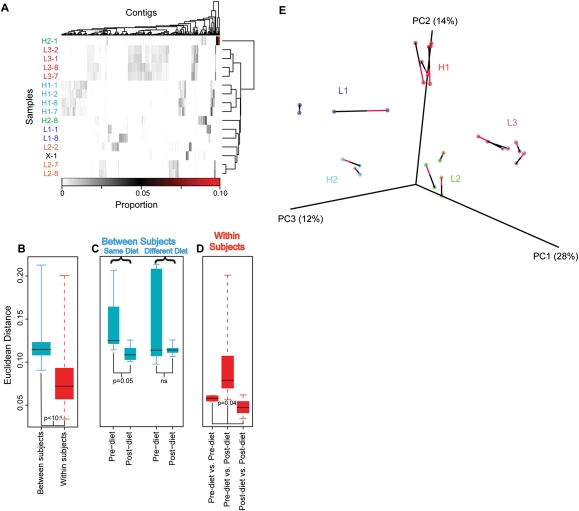
Immense populations of viruses are present in the human gut and other body sites. Understanding the role of these populations (the human "virome") in health and disease requires a much deeper understanding of their composition and dynamics in the face of environmental perturbation. Here, we investigate viromes from human subjects on a controlled feeding regimen. Longitudinal fecal samples were analyzed by metagenomic sequencing of DNA from virus-like particles (VLP) and total microbial communities. Assembly of 336 Mb of VLP sequence yielded 7175 contigs, many identifiable as complete or partial bacteriophage genomes. Contigs were rich in viral functions required in lytic and lysogenic growth, as well as unexpected functions such as viral CRISPR arrays and genes for antibiotic resistance. The largest source of variance among virome samples was interpersonal variation. Parallel deep-sequencing analysis of bacterial populations showed covaration of the virome with the larger microbiome. The dietary intervention was associated with a change in the virome community to a new state, in which individuals on the same diet converged. Thus these data provide an overview of the composition of the human gut virome and associate virome structure with diet.


Figures

Figure 1.
Figure 1.
Purification of VLP DNA. Stool was homogenized in SM Buffer; particulate matter was spun down; supernatant was filtered at 0.22 μm to remove cells; VLPs were purified on a CsCl density gradient and treated with nuclease to eliminate unprotected DNA. The absence of bacterial cells was confirmed by staining VLP preparations for nucleic acids. VLP DNA was quantified, amplified, and pyrosequenced.
Figure 2.
Figure 2.
Assembly and functional annotation of shotgun metagenomic sequences from the human gut virome. (A) Analysis of recruitment of VLP sequence reads into contigs. The y-axis shows the number of sequence reads, the x-axis shows contig length. Pyrosequencing data from the human virome were assembled into 7147 contigs up to 47.8 kb in length. Linear contigs are shown in yellow, circular contigs are shown in blue. (B) Analysis of protein functions in VLP contigs. The functions encoded in VLP contigs were predicted using the Pfam database, then grouped using custom database-relating Pfam domain identifiers to phage functions (Supplemental Table S4). The relative proportions of pyrosequencing reads falling within ORFs of different annotations were plotted according to their sample of origin (y-axis). Each bar is indicated by the sample code, where L or H indicates low- or high-fat diet, the adjacent number indicates the subject number, and the number after the hyphen indicates the day of the study. “X-1” indicates ad-lib diet. (C) Taxonomic classification of VLP communities is consistent across samples. Samples (in columns, labeled as in Figs. 1, 5) are characterized according to the number of sequences from each sample that are assembled into a contig that is classified by taxonomic family. Phage families are indicated by the color code to the right. “Unknown” (black) indicates contigs that cannot be classified in any way. “Multiple hits” (white) indicate contigs that have proteins that are similar to multiple families.
Figure 3.
Figure 3.
Comparison of gene content in total microbial communities and VLP communities. (A) The proportions of total genes identified in shotgun metagenomic analysis of total stool DNA (left) is compared with genes in VLP communities (right). (B) VLP DNA encodes biochemical functionality that is markedly different from the total microbiome. Function annotation was performed according to comparison to the COG database (Tatusov et al. 2003). The proportion of reads from each assembled data set that fall within an ORF of the indicated annotation are plotted on the x-axis (mean ± SE).
Figure 4.
Figure 4.
Analysis of temperate bacteriophages in the human gut virome. (A) Venn diagram indicating frequency of functions associated with temperate phages. VLP contigs were annotated according to the presence of integrase-like sequences (orange), BLAST alignment to sequenced bacterial genomes, suggestive of prophage formation (90% length at 90% identity; green), and presence of multiple genes with significant similarity to a prophage element within the ACLAME database (red). Map of VLP pyrosequencing reads aligning to the genomes of (B) Faecalibacterium prausnitzii L2/6 and (C) Parabacteroides distasonis ATCC 8503 (90% length at 90% identity). (Inset) Contigs that correspond to each peak, the reads that make up each contig, and their annotated genes. Top strand reads are indicated by blue, bottom strand reads by gray. (D) Prevalence of prophage sequences according to bacterial phylum of origin. Contigs with amino acid similarity (E-value < 10−5) to prophage sequences within the ACLAME databases are shown according to which bacterial phylum they match. Any contig with similarity to more than one phylum is classified as “Multiple.” Roughly 39% of VLP contigs (n = 2814) did not have significant similarity to any prophage sequence in this database.
Figure 5.
Figure 5.
Alterations in VLP contig abundance associated with diet. (A) Proportions of VLP sequence reads in contigs from different subjects and time points. Vertical bars indicate the proportion of reads within each contig. The contigs are shown in columns, and subject/time-point combinations in rows. Hierarchical clustering was performed on both rows and columns according to Euclidean distance and complete distance agglomeration. Samples are labeled by subject according to diet: high-fat (H1, H2), low-fat (L1, L2, L3), and ad-lib (X), as well as day of dietary intervention (days 1, 2, 7, or 8). The proportion of all VLP reads in each contig are shown by the scale at the bottom. (B,C,D) The Euclidean distance between samples is shown according to median (line), quartile (box), and range (whisker). (B) Between-subject variation is significantly greater than within-subject variation (P < 10−4, subject label permutation). (C) The distance between the gut viromes of individuals on the same diet (left) was significantly smaller at the end of their dietary treatment than it was at the start (P = 0.05, permutation of diet labels), while there was no increase in similarity for individuals on different diets (right). (D) The distances within subjects that was measured between samples taken on the first 2 d of the timecourse (left) and the last 2 d of the timecourse (right) were significantly lower than the distances between those two sets of days (middle; P = 0.04, permutation of day labels). (E) Covariation of bacterial and VLP community diversity. Distances between pairs of bacterial and VLP communities were calculated as described in the Methods. The similarity of bacterial and VLP communities is shown through PCoA analysis, where each data set was rotated and scaled for maximum superimposition. Each circle represents a sample, either bacterial or VLP. The bacterial and VLP communities from the same sample are connected by a line, where the red half of the line touches the VLP community, and the black half touches the bacterial community. The percent of total variation accounted for by each axis is shown in the axis label. The alignment of bacterial and VLP communities was highly significant (P = 0.004).

References

    1. Angly F, Rodriguez-Brito B, Bangor D, McNairnie P, Breitbart M, Salamon P, Felts B, Nulton J, Mahaffy J, Rohwer F 2005. PHACCS, an online tool for estimating the structure and diversity of uncultured viral communities using metagenomic information. BMC Bioinformatics 6: 41 doi: 10.1186/1471-2105-6-41 - PMC - PubMed
    1. Barlow M 2009. What antimicrobial resistance has taught us about horizontal gene transfer. Methods Mol Biol 532: 397–411 - PubMed
    1. Bohannan BJM, Lenski RE 1997. Effect of resource enrichment on a chemostat community of bacteria and bacteriophage. Ecology 78: 2303–2315
    1. Breitbart M, Hewson I, Felts B, Mahaffy JM, Nulton J, Salamon P, Rohwer F 2003. Metagenomic analyses of an uncultured viral community from human feces. J Bacteriol 185: 6220–6223 - PMC - PubMed
    1. Breitbart M, Haynes M, Kelley S, Angly F, Edwards RA, Felts B, Mahaffy JM, Mueller J, Nulton J, Rayhawk S, et al. 2008. Viral diversity and dynamics in an infant gut. Res Microbiol 159: 367–373 - PubMed

Publication types

MeSH terms

Substances

LinkOut - more resources