. 2011 Aug 31;31(35):12501-12.
doi: 10.1523/JNEUROSCI.2234-11.2011.

Saccadic inhibition reveals the timing of automatic and voluntary signals in the human brain

Affiliations

Saccadic inhibition reveals the timing of automatic and voluntary signals in the human brain

Aline Bompas et al. J Neurosci. .

Abstract

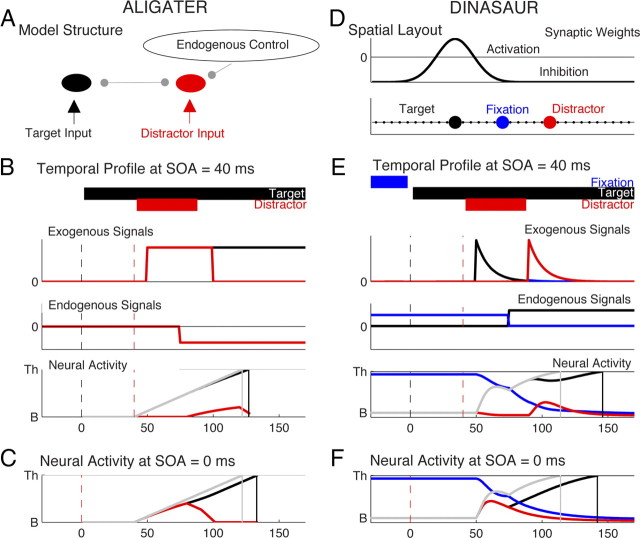
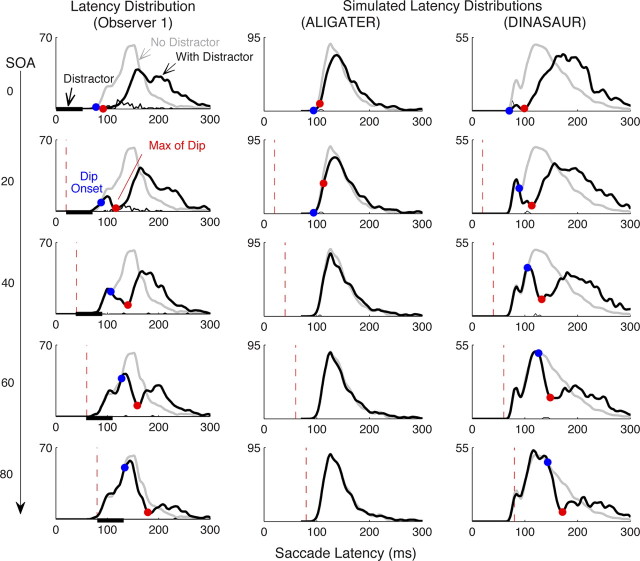
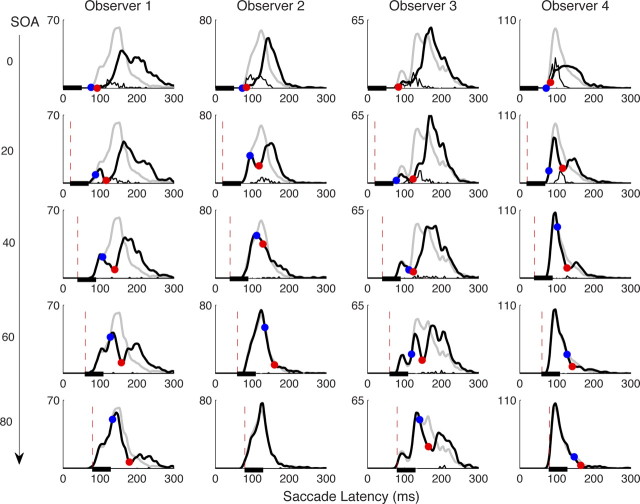
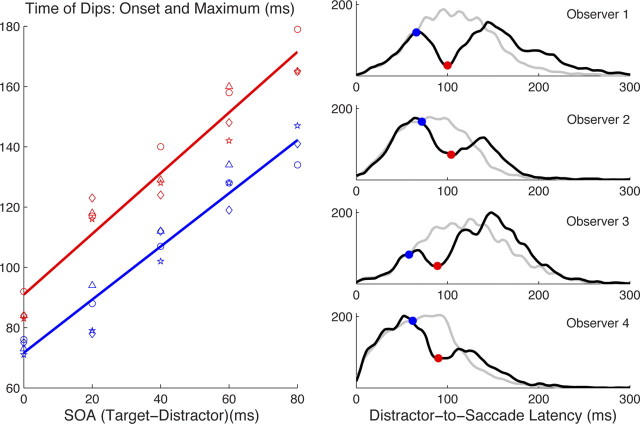
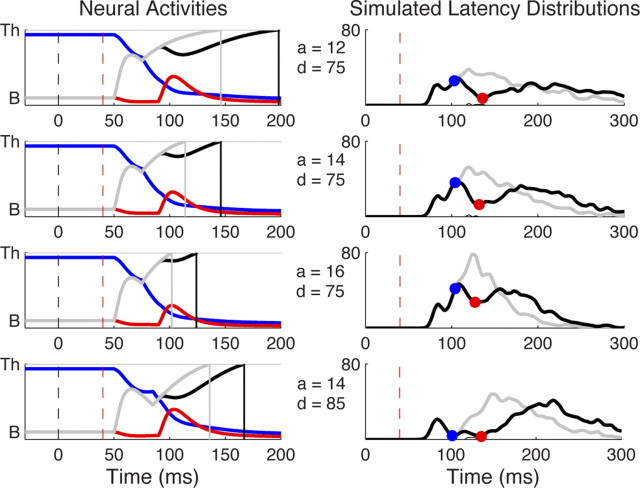
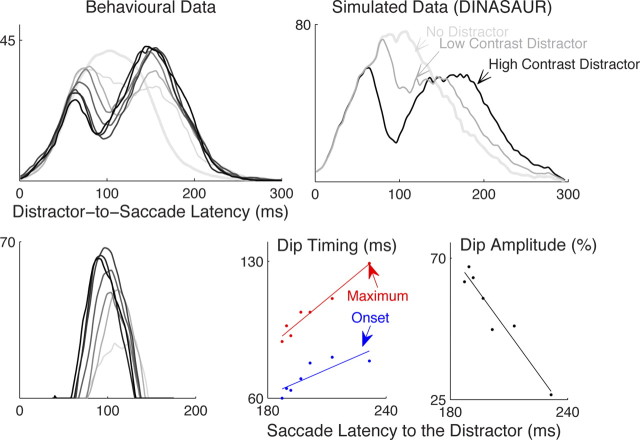
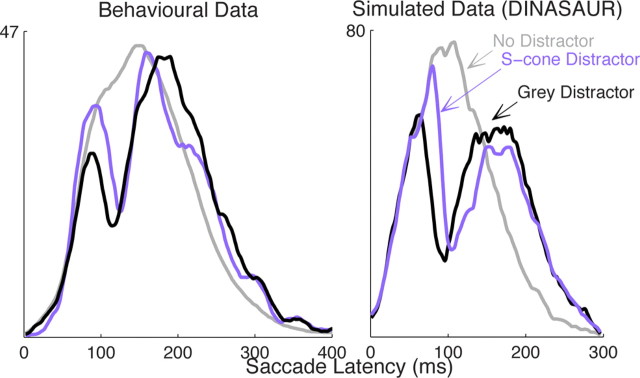
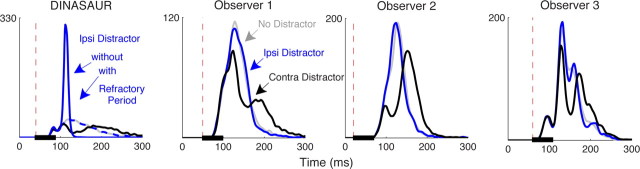
Neurophysiological and phenomenological data on sensorimotor decision making are growing so rapidly that it is now necessary and achievable to capture it in biologically inspired models, for advancing our understanding in both research and clinical settings. However, the main impediment in moving from elegant models with few free parameters to more complex biological models in humans lies in constraining the more numerous parameters with behavioral data (without human single-cell recording). Here we show that a behavioral effect called "saccadic inhibition" (1) is predicted by existing complex (neuronal field) models, (2) constrains crucial temporal parameters of the model, precisely enough to address individual differences, and (3) is not accounted for by current simple decision models, even after significant additions. Visual onsets appearing while an observer plans a saccade knock out a subpopulation of saccadic latencies that would otherwise occur, producing a clear dip in the latency distribution. This overlooked phenomenon is remarkably well time locked across conditions and observers, revealing and characterizing a fast automatic component of visual input to oculomotor competition. The neural field model not only captures this but predicts additional features that are borne out: the dips show spatial specificity, are lawfully modulated in contrast, and occur with S-cone stimuli invisible to the retinotectal route. Overall, we provide a way forward for applying precise neurophysiological models of saccade planning in humans at the individual level.


Figures

Figure 1.
Figure 1.
A–C, Key features and behavior of our ALIGATER model. A, Architecture of ALIGATER, a LATER-type model with additional mutual inhibition and endogenous inhibition of distractor activity. B, Illustration of the stimulus display times, the temporal profile of exogenous and endogenous inputs, and the resultant median activity profile in each node in the ALIGATER model. These are shown for the conditions of experiment 1 at SOA = 40 ms, for target (black) and distractor (red) stimuli. The neural activity for target in the absence of distractor is a linear rise from baseline to threshold after a delay δvis (gray curve), which is slightly delayed (black curve) in the presence of a distractor by mutual inhibition. Distractor activity (red curve) is inhibited by mutual inhibition and by endogenous signals after a delay δendo. Saccade latency is given by the thin vertical continuous gray and black lines followed by a fixed execution time δout. C, Neural activities in the ALIGATER model at SOA = 0 ms (same conventions as B). D–F, Illustration of the key features in DINASAUR models, inspired from Trappenberg et al. (2001). D, Spatial interaction profile (here for the target stimulus), relative to the positioning of the stimuli in our study. E, Illustration, for fixation (blue), target (black), and distractor (red) stimuli, of the stimulus display times, the temporal profile of exogenous and endogenous inputs, and the resultant average (noise-free) activity profile in each node (same conventions as B). The vertical gray line shows a saccadic latency (minus δout) that would therefore be present in the no-distractor condition but knocked out of the distractor condition, contributing to the dip. The vertical black line shows a latency (minus δout) that would then be over-represented in the distractor distribution relative to the no-distractor case (the recovery period). F, Average neural activities from DINASAUR model at SOA = 0 ms (same conventions as B).
Figure 2.
Figure 2.
The effect of irrelevant stimuli on saccade latency distributions measured behaviorally on one representative observer (from experiment 1; see Fig. 3 for all observers) and simulated by two types of model. Each row represents a different SOA between target and distractor stimuli (black bars illustrate distractor timing). The left column plots saccadic latency distributions measured in the no-distractor (gray line) and distractor (thick black line) conditions. Note how the two distributions coincide in each SOA condition until the beginning of the dip and that the delays of dip beginning (blue circle) and dip maximum (red circle; see Materials and Methods for definitions) from distractor onset (dashed line) is highly consistent. Thin black lines indicate incorrect saccades toward the distractor. The middle column shows simulated latency distributions from the ALIGATER model, in our best attempt to produce dips at SOA = 40 ms. We can see that the model succeeds in producing some distractor effect at SOA = 0 but fails to produce any clear dip for longer SOA. The right column shows simulated latency distributions from the DINASAUR model, which successfully captures the dips and subsequent recovery period (as well as the small express saccade mode).
Figure 3.
Figure 3.
Saccadic latency distributions in experiment 1 for each of the four observers (columns) and each distractor onset time (rows). The same conventions are used as in the left column of Figure 1.
Figure 4.
Figure 4.
The consistent timing of dips between conditions and observers. Left, The beginning (blue) and maximum (red) of the dips (with respect to the target onset) both showed a clear linear relationship with SOA between target and distractor, with a slope near unity (data from observers 1–4 are represented as circles, triangles, diamonds, and stars, respectively; for observer 2, the point at 80 ms SOA is missing because the latency distribution was narrow enough that these distractors were too late to produce a dip; see Fig. 3). Right, Pooling across SOA conditions aligned on distractor onset gives “distractor-to-saccade” latency distributions, from which the beginning (blue) and maximum (red) of dips can be clearly seen for each observer. For the no-distractor condition (gray), equivalent distributions were produced in the following way: because the distractor-to-saccade distributions are a combination of five latency distributions for which the targets occurred at 0, −20, −40, −60, and −80 ms, we pooled five copies of the no-distractor condition with targets at these same times (relative to the 0 on the distractor-to-saccade plot). Note that this pooling of five distributions, whose peaks are therefore 20 ms apart, is what causes the bumps in the pooled data (they are not noise).
Figure 5.
Figure 5.
Noise-free neural activities (left column) and latency distributions (right column) simulated by DINASAUR for four combinations of amplitude aendo and delay δendo of endogenous signal (same conventions as in Figs. 1 and 2) at SOA = 40 ms. Increasing aendo from 12 to 16 (3 top lines) speeds up the sustained rise to threshold of target activity (black and gray curves), therefore reducing the reaction time of the main mode of the latency distribution but leaving the early mode unaffected. Direct consequences of this are a reduction of distractor activity (red curves) through mutual inhibition, as well as faster recovery of the disturbed saccades, which both reduce the size of the dip. Increasing δendo from 75 to 85 (compare lines 2 and 4) mainly affects the distance between the early and main modes in the latency distribution, making the early mode more apparent by delaying the main mode, but it also has similar effects on the dip as reducing aendo.
Figure 6.
Figure 6.
Distractor contrast lawfully modulates dip delay and amplitude. Top left, Distractor-to-saccade distributions (average of all late distractor SOAs and all three observers from Bompas and Sumner, 2009b) are plotted with increasing distractor contrasts illustrated by darker shades of gray, whereas the thicker light gray line shows the no-distractor condition. Bottom left, Distraction ratio for each contrast. Top right, The effect of growing distractor contrast is simulated in the DINASAUR model by decreasing the delay and increasing the strength of exogenous signals. Bottom right, TM (red), T0 (blue), and amplitude of dips (green) all correlate well with saccadic latency to the distractor stimuli (when they are used as targets).
Figure 7.
Figure 7.
Left, Chromatic S-cone stimuli produce dips (purple curve) similar in size to those for achromatic distractors matched in salience (black), but delayed, consistent with the later arrival of chromatic information in SC. Note that S-cone stimuli presented on a background of luminance noise are thought to be invisible to the retinotectal pathway. The dip for S-cone distractors (purple) is plotted on a distractor-to-saccade distribution (average of all late distractor SOAs and all five observers from Bompas and Sumner, 2009a), and the gray line illustrates the no-distractor condition. Right, The effect of chromaticity is simulated in the DINASAUR model by increasing the delay of exogenous signals.
Figure 8.
Figure 8.
Simulated and observed latency distribution in the no-distractor (gray), contralateral (black), and ipsilateral (blue) distractor conditions. The left shows the prediction from the DINASAUR model with (dashed blue) and without (solid blue) refractory period that prevents the summation of two visual signals appearing close in time and space. The three next panels show the results from the three observers. Whereas contralateral distractors produce dips, ipsilateral distractors do not differ from the no-distractor condition, consistent with the effect of a refractory period on the model. The black bar illustrates distractor onset time, which was set to produce a clear dip for each observer, based on their latency distributions in experiment 1 (Fig. 2).

References

    1. Anderson AJ, Carpenter RH. The effect of stimuli that isolate S-cones on early saccades and the gap effect. Proc R Soc Lond B Biol Sci. 2008;275:335–344. - PMC - PubMed
    1. Antoniades CA, Altham PM, Mason SL, Barker RA, Carpenter R. Saccadometry: a new tool for evaluating presymptomatic Huntington patients. Neuroreport. 2007;18:1133–1136. - PubMed
    1. Bichot NP, Schall JD. Priming in macaque frontal cortex during popout visual search: feature-based facilitation and location-based inhibition of return. J Neurosci. 2002;22:4675–4685. - PMC - PubMed
    1. Bompas A, Sumner P. Sensory sluggishness dissociates saccadic, manual, and perceptual responses: an S-cone study. J Vis. 2008;8:1–13. - PubMed
    1. Bompas A, Sumner P. Oculomotor distraction by signals invisible to the retinotectal and magnocellular pathways. J Neurophysiol. 2009a;102:2387–2395. - PubMed

Publication types

LinkOut - more resources