. 2011 Aug 31;31(35):12513-22.
doi: 10.1523/JNEUROSCI.2236-11.2011.

Dopamine-dependent long-term depression is expressed in striatal spiny neurons of both direct and indirect pathways: implications for Parkinson's disease

Affiliations

Dopamine-dependent long-term depression is expressed in striatal spiny neurons of both direct and indirect pathways: implications for Parkinson's disease

Vincenza Bagetta et al. J Neurosci. .

Abstract

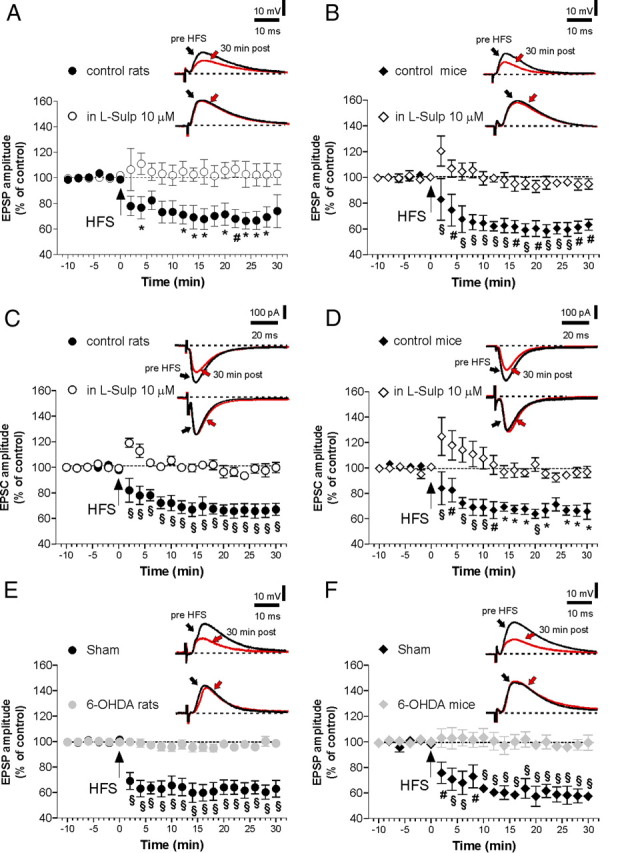
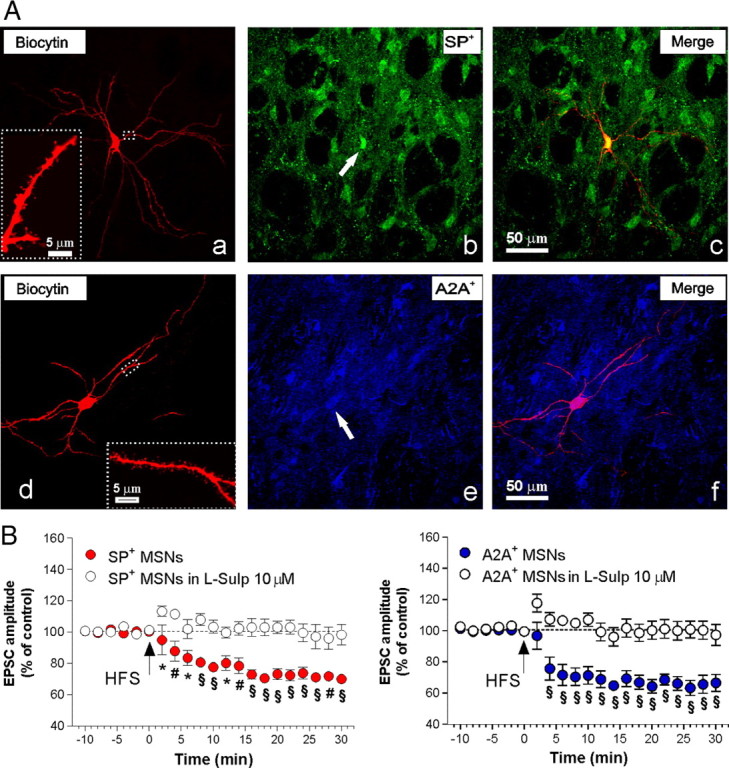
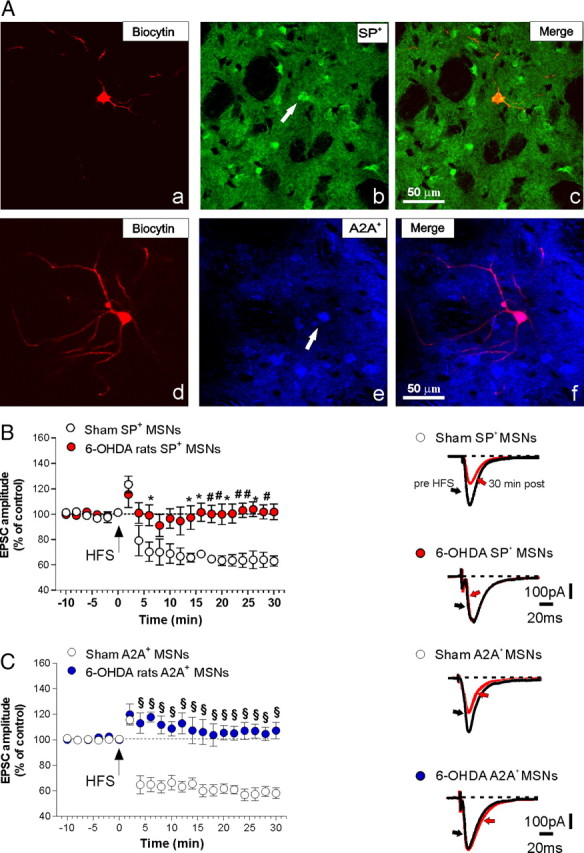
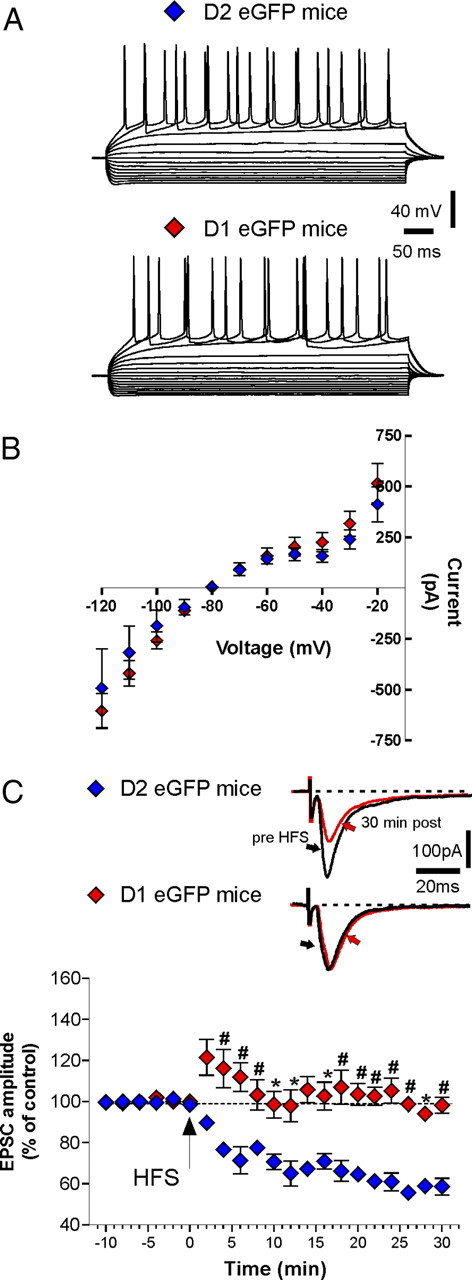
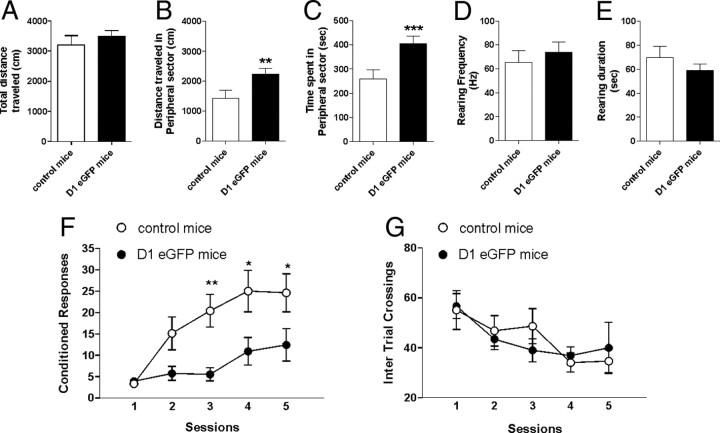
Striatal medium spiny neurons (MSNs) are divided into two subpopulations exerting distinct effects on motor behavior. Transgenic mice carrying bacterial artificial chromosome (BAC) able to confer cell type-specific expression of enhanced green fluorescent protein (eGFP) for dopamine (DA) receptors have been developed to characterize differences between these subpopulations. Analysis of these mice, in contrast with original pioneering studies, showed that striatal long-term depression (LTD) was expressed in indirect but not in the direct pathway MSNs. To address this mismatch, we applied a new approach using combined BAC technology and receptor immunohistochemistry. We demonstrate that, in physiological conditions, DA-dependent LTD is expressed in both pathways showing that the lack of synaptic plasticity found in D(1) eGFP mice is associated to behavioral deficits. Our findings suggest caution in the use of this tool and indicate that the "striatal segregation" hypothesis might not explain all synaptic dysfunctions in Parkinson's disease.


Figures

Figure 1.
Figure 1.
HFS elicits LTD in MSNs recorded from control rats and mice but not in 6-OHDA-lesioned animals. A, B, The graphs show the time course of LTD in MSNs recorded by patch-clamp/sharp electrode techniques in current-clamp mode, respectively, from control rats slices and control mice slices, before (n = 20 for each group) and after the application of the D2 receptor antagonist l-sulpiride (n = 10). Insets, n = 8 averaged traces of EPSPs before and 30 min after the delivery of HFS. Calibration bars: 10 mV, 10 ms. Stimulus artifacts have been truncated. C, D, EPSC amplitudes before and after LTD induction protocol in control condition and in the presence of l-sulpiride in patch-clamp recordings in voltage clamp, respectively, from MSNs in rats and mice (n = 10 for each condition). Insets, Waveforms are averages of n = 8 EPSCs from single experiments at the times indicated. Calibration bars: 100 pA, 20 ms. Stimulus artifacts have been truncated. Pre- versus post-HFS in l-sulpiride, p > 0.05; control versus plus l-sulpiride, *p < 0.05, #p < 0.01, §p < 0.001. E, F, EPSC plotted amplitude before and after HFS in 6-OHDA-lesioned and sham-operated animals, either in rats (E) (n = 10) or mice (F) (n = 10). Averaged EPSC traces are shown as insets, at the times indicated. Pre- versus post-HFS in 6-OHDA animals, p > 0.05; sham versus 6-OHDA rats, #p < 0.01, §p < 0.001. Error bars indicate SEM.
Figure 2.
Figure 2.
D2 receptor antagonism prevents synaptic plasticity in both the direct and indirect pathway neurons. A, Confocal laser-scanning microscopy images of double-labeled immunofluorescence for biocytin and SP (a–c) and biocytin and adenosine A2A receptor (A2A) (d–f). Biocytin immunolabeling is visualized in streptavidin-Cy3 fluorescence (a, d), while SP (b) and A2A (e) are, respectively, visualized in green-Cy2 or blue-Cy5 fluorescence. The merged image is shown in the two panels on the right (c, f). The white arrows show the colocalization of SP- or A2A-positive medium spiny projection neurons with the cell filled with biocytin. Scale bar, 50 μm. In a and d, higher magnification shows branched dendrites characteristic of intracellularly filled medium spiny neurons (MSNs). Scale bar, 5 μm. B, The left panel shows the time course of the changes in EPSC amplitude in SP+ MSNs after the delivery of HFS, in absence (n = 5; filled circles) or in presence of l-sulpiride (10 μm) (n = 6; open circles). In the right panel is reported the time course of EPSC from A2A+ MSNs after HFS in control condition (n = 5) or in the presence of l-sulpiride (n = 6). Pre- versus post-HFS in l-Sulp, p > 0.05 in SP+ neurons; pre- versus post-HFS in l-Sulp, p > 0.05 in A2A+ neurons; SP+ versus plus l-sulpiride, *p < 0.05, #p < 0.01, §p < 0.001; A2A+ versus plus l-sulpiride, §p < 0.001. Error bars indicate SEM.
Figure 3.
Figure 3.
Striatal DA denervation blocks LTD induction in both SP+ and A2A+ medium spiny neurons (MSNs). A, Confocal laser-scanning microscopy images of double-labeled immunofluorescence showing biocytin and SP (a–c) and biocytin and adenosine A2A receptor (A2A) (d–f) from 6-OHDA-lesioned rats. A, Biocytin immunolabeling is visualized in streptavidin-Cy3 fluorescence (a, d), while SP (b) is revealed by green-Cy2 fluorescence and A2A (e) is visualized by blue-Cy5 fluorescence. The merged image is shown in the left panel (c, f). The white arrows show the colocalization of SP- or A2A-positive medium spiny projection neurons with the cell filled with biocytin. Scale bar, 50 μm. B, C, In the left panel is reported the time course of LTD in MSNs recorded from SP+, or A2A+, either from control rats or 6-OHDA-lesioned animals (n = 5 for each group). The right panels in B and C show averaged traces of the EPSC 10 min before and 30 min after the delivery of HFS. 6-OHDA SP+, pre- versus post-HFS, p > 0.05; sham SP+ versus 6-OHDA SP+, *p < 0.05, #p < 0.01. 6-OHDA A2A+ pre- versus post-HFS, p > 0.05; sham A2A+ versus 6-OHDA A2A+, §p < 0.001. Error bars indicate SEM. Calibration bars: 100 pA, 20 ms.
Figure 4.
Figure 4.
Electrophysiological characterization of D1 and D2 eGFP mice and lack of LTD in D1 eGFP mice. A, Examples of current-clamp recordings obtained from two MSNs in D1 eGFP and D2 eGFP mice, representing responses to a series of hyperpolarizing and depolarizing pulses of currents (from −400 pA up to +200 pA, delta between pulses 50 pA, 500 ms duration). B, The graph shows current–voltage plots generated by measuring the voltage change as a function of current intensity in MSNs recorded from direct and indirect pathway (n = 8 for each group). C, The graph shows LTD in D2 eGFP (blue diamonds; n = 12) mice but not in D1 eGFP (red diamonds; n = 13). Pre- versus post-HFS, p > 0.05; D2 eGFP MSNs versus D1 eGFP MSNs, *p < 0.05, #p < 0.01. Error bars indicate SEM. The insets show representative averaged traces of the EPSC evoked, respectively, 10 min before and 30 min after the delivery of HFS, respectively, in D2 (top inset) and D1 (bottom inset) mice. Calibration bars: 100 pA, 20 ms.
Figure 5.
Figure 5.
LTD is expressed in nonfluorescent MSNs recorded from either D1 eGFP or D2 eGFP mice. A, In the top panel are represented confocal laser-scanning microscopy images of double-labeled immunofluorescence for biocytin and SP in eGFP D2 mice (a–d). a, In the left panel is shown a nonfluorescent MSN in a D2 eGFP mice (white arrow). Biocytin immunolabeling is visualized in streptavidin-Cy3 fluorescence (b), while SP (c) is visualized in blue-Cy5 fluorescence. The merged image is shown in d. The white arrows show the colocalization of substance P-positive medium spiny projection neurons with the cell filled with biocytin. Scale bar, 50 μm. In the left bottom panel is represented the time course of LTD in nonfluorescent neurons recorded from eGFP D2 mice in the presence and absence of l-sulpiride (n = 6 for each group). The right panel shows the averaged traces of EPSCs recorded 10 min before and 30 min after the delivery of HFS protocol. Calibration bars: 100 pA, 20 ms. B, In the top panel are represented confocal laser-scanning microscopy images of double-labeled immunofluorescence for biocytin and SP in eGFP D2 mice (a–d). Biocytin immunoreactivity is revealed by streptavidin-Cy3 fluorescence (b), while A2A (c) is labeled by blue-Cy5 fluorescence. The merged image is shown in the right panel (d). The white arrows show the colocalization of substance P-positive medium spiny projection neurons with the cell filled with biocytin. Note in this field the cell filled with biocytin co-contains A2A, whereas is devoid of D1 receptor (white arrows). Scale bar, 50 μm. The bottom panel on the left shows the time course of LTD in nonfluorescent neurons recorded from D1 eGFP mice, identified as A2A-positive neurons, in the presence and absence of l-sulpiride (n = 6 for each group). SP+ versus SP+ plus l-sulpiride or A2A+ versus A2A+ plus l-sulpiride, #p < 0.01, §p < 0.001. Error bars indicate SEM. In the right panel are reported representative traces of the EPSCs evoked 10 min before and 30 min after the delivery of HFS. Calibration: 100 pA, 20 ms.
Figure 6.
Figure 6.
Behavioral alterations in D1 eGFP mice. A–E, Mice were exposed to the open field and their locomotor activity was monitored for 10 min (D1 eGFP, n = 9, black bar; control mice, n = 8, white bar). A, Total distance traveled in the open field test in D1 eGFP and control mice. B, C, Bar graphs showing, respectively, the distance traveled and the time spent by D1 eGFP and control mice in the peripheral area. Control mice versus D1 eGFP mice, **p < 0.01. Control mice versus D1 eGFP mice, ***p < 0.001. D, E, Vertical exploratory activity is indicated as rearing duration and rearing frequency in the two bar graphs. F, G, Striatal-dependent learning abilities of D1 eGFP mice and control mice were tested using a two-way AA test. F, The graph shows the mean number of avoidance responses per day ± SEM recorded for each group (n = 15). Two-way ANOVA revealed an effect of interaction session by genotype, indicating that performances were lower in D1 eGFP (filled circles) than in control mice (open circles). *p < 0.05; **p < 0.01. G, Mean number of crossings between the two compartments per day ± SEM are reported. Two-way ANOVA revealed no significant group main effect, indicating that locomotion did not significantly differ between genotypes.

Similar articles

Cited by

References

    1. Ade KK, Janssen MJ, Ortinski PI, Vicini S. Differential tonic GABA conductances in striatal medium spiny neurons. J Neurosci. 2008;28:1185–1197. - PMC - PubMed
    1. André VM, Cepeda C, Cummings DM, Jocoy EL, Fisher YE, William Yang X, Levine MS. Dopamine modulation of excitatory currents in the striatum is dictated by the expression of D1 or D2 receptors and modified by endocannabinoids. Eur J Neurosci. 2010;31:14–28. - PubMed
    1. Bagetta V, Ghiglieri V, Sgobio C, Calabresi P, Picconi B. Synaptic dysfunction in Parkinson's disease. Biochem Soc Trans. 2010;38:493–497. - PubMed
    1. Beckstead RM, Kersey KS. Immunohistochemical demonstration of differential substance P-, met-enkephalin-, and glutamic-acid-decarboxylase-containing cell body and axon distributions in the corpus striatum of the cat. J Comp Neurol. 1985;232:481–498. - PubMed
    1. Bertran-Gonzalez J, Bosch C, Maroteaux M, Matamales M, Hervé D, Valjent E, Girault JA. Opposing patterns of signaling activation in dopamine D1 and D2 receptor-expressing striatal neurons in response to cocaine and haloperidol. J Neurosci. 2008;28:5671–5685. - PMC - PubMed

Publication types

MeSH terms