. 2011 Aug 31;31(35):12579-92.
doi: 10.1523/JNEUROSCI.2738-11.2011.

The atypical Guanine-nucleotide exchange factor, dock7, negatively regulates schwann cell differentiation and myelination

Affiliations

The atypical Guanine-nucleotide exchange factor, dock7, negatively regulates schwann cell differentiation and myelination

Junji Yamauchi et al. J Neurosci. .

Abstract

In development of the peripheral nervous system, Schwann cells proliferate, migrate, and ultimately differentiate to form myelin sheath. In all of the myelination stages, Schwann cells continuously undergo morphological changes; however, little is known about their underlying molecular mechanisms. We previously cloned the dock7 gene encoding the atypical Rho family guanine-nucleotide exchange factor (GEF) and reported the positive role of Dock7, the target Rho GTPases Rac/Cdc42, and the downstream c-Jun N-terminal kinase in Schwann cell migration (Yamauchi et al., 2008). We investigated the role of Dock7 in Schwann cell differentiation and myelination. Knockdown of Dock7 by the specific small interfering (si)RNA in primary Schwann cells promotes dibutyryl cAMP-induced morphological differentiation, indicating the negative role of Dock7 in Schwann cell differentiation. It also results in a shorter duration of activation of Rac/Cdc42 and JNK, which is the negative regulator of myelination, and the earlier activation of Rho and Rho-kinase, which is the positive regulator of myelination. To obtain the in vivo evidence, we generated Dock7 short hairpin (sh)RNA transgenic mice. They exhibited a decreased expression of Dock7 in the sciatic nerves and enhanced myelin thickness, consistent with in vitro observation. The effects of the in vivo knockdown on the signals to Rho GTPases are similar to those of the in vitro knockdown. Collectively, the signaling through Dock7 negatively regulates Schwann cell differentiation and the onset of myelination, demonstrating the unexpected role of Dock7 in the interplay between Schwann cell migration and myelination.


Figures

Figure 1.
Figure 1.
Dock7 is downregulated following sciatic nerve development. A, Tissue extracts were prepared from rat sciatic nerves on Embryonic Day 18 (E18) or Postnatal Day 1–14 (P1–P14), or upon adulthood, subjected to SDS-PAGE, transferred to PVDF membranes, and immunoblotted with an antibody against Dock7, (pY1118)Dock7, Rho GTPases Rac1/Cdc42, the myelin marker protein MPZ, or actin (as a control). B, The band intensities of an immunoblot with an anti-(pY1118)Dock7 antibody are shown as the relative intensities (n = 3). C, RT-PCR analysis shows that Dock7 mRNA is abundantly present in primary Schwann cells and very weakly present in primary DRG neuronal cells. RT-PCR analysis for β-actin and Dock11 was performed as the control. D, 293T cell lysates were immunoblotted with an antibody against a KLYPDGRVRPTRE peptide consensus in rat, mouse, and human Dock7 in the presence of an antigen peptide (right panel) or with an antibody in a control vehicle (left panel). In 293T cells, this antibody primarily recognizes >200 kDa of the full-length Dock7, which disappears in response to the treatment with antigen peptide. The lower bands (88–110 kDa) may correspond to the alternatively spliced variant of Dock7 (GenBank Acc. No. DQ309763) and/or may be degradation products of Dock7. Data were evaluated using one-way ANOVA (*p < 0.01).
Figure 2.
Figure 2.
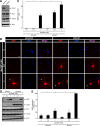
Dock7 knockdown promotes dibutyryl cAMP-induced morphological differentiation. A, Rat primary Schwann cells were transfected with siRNA for Dock7 or control luciferase, lysed, and immunoblotted with an antibody against Dock7, Rac1, Cdc42, or actin. B, Dock7 or luciferase siRNA-transfected Schwann cells were treated with 0, 0.3, or 1 mm dibutyryl cAMP for 2 d. Immunostaining with an anti-MBP antibody (red) and nuclear DAPI (blue) staining were performed. MBP-positive cells exhibit more flattened shapes with extending branched processes. Scale bar, 30 μm. The arrow indicates a myelin web-like structure with fenestrated cytoplasmic sheets. C, The percentages of MBP-expressing, morphologically differentiated Schwann cells were calculated (n = 4). D, Schwann cells transfected with Dock7 or luciferase siRNA were treated with 0–1 mm dibutyryl cAMP for 2 d, lysed, and immunoblotted with an antibody against MPZ, Dock7, Rac1, Cdc42, or actin. E, The band intensities for MPZ are shown as the relative intensities (n = 4). Data were evaluated using one-way ANOVA (*p < 0.01).
Figure 3.
Figure 3.
Dock7 knockdown changes Rac1/Cdc42/JNK signaling in Schwann cells. A–D, Dock7 or luciferase siRNA-transfected Schwann cells were collected at 0–48 h following stimulation with 1 mm dibutyryl cAMP. GTP-bound Rac1 or Cdc42 was affinity precipitated with GST-CRIB, which specifically binds to GTP-bound Rac1 and Cdc42, from Schwann cell lysates, and immunoblotted with an anti-Rac1 or Cdc42 antibody. Total Rac1 and Cdc42 levels were comparable. GTP-bound Rac1 and Cdc42 are shown as relative values (n = 3). E, F, JNK1 in Schwann cell lysates was immunoprecipitated with anti-JNK1 antibody from Schwann cell lysates and immunoblotted with an anti-(pThr183/pTyr185)JNK antibody, which recognizes active JNK. Total JNK1 levels were comparable. JNK phosphorylation is shown as a relative value (n =3). G, H, Schwann cells were treated with or without 1 mm dibutyryl cAMP in the presence or absence of 10 μm JNK inhibitor I or SP600125 for 48 h. The percentages of MBP-expressing Schwann cells are shown (n = 4). Data were evaluated using one-way ANOVA (*p < 0.01; **p < 0.02).
Figure 4.
Figure 4.
Dock7 knockdown changes RhoA/Rho-kinase signaling in Schwann cells. A, B, GTP-bound RhoA was affinity precipitated with GST-RBD, which specifically binds to GTP-bound RhoA, from Schwann cell lysates, and immunoblotted with an anti-RhoA antibody. Total RhoA levels were comparable. GTP-bound RhoA is shown as a relative value (n = 3). C, D, Schwann cell lysates were immunoblotted with an anti-(pT853)MBS antibody, which recognizes a Rho-kinase-specific phosphorylation site. Total MBS levels were comparable. MBS phosphorylation is shown as a relative value (n = 3). E, Schwann cells were treated with or without 1 mm dibutyryl cAMP in the presence or absence of 10 μm Y27632 for 48 h. The percentages of MBP-expressing Schwann cells are shown (n = 4). Data were evaluated using one-way ANOVA (*p < 0.01).
Figure 5.
Figure 5.
Expression of Dock7 shRNA in mice. A, Schematic diagram of the injected, linearized DNA possessing both the Dock7 shRNA transcription sequence (U6 promoter, Dock7 shRNA, and RNA transcription stop signal) and the EGFP translation sequence (ferritin heavy chain FerH composite promoter, EGFP, and EF1 polyA) (top panel). Mouse genotyping was performed by PCR with the specific primer pairs for the egfp (primers 1 and 2) and mouse U6 (primers 3 ad 4) sequence. The oct3/4 gene is also shown as a control. In this experiment, Mouse #3 and Mouse #4 are transgene-positive (bottom left panel). Dock7 shRNA transgenic mouse splenocytes were isolated and splenocyte chromosomes were used in FISH analysis with a Cy3 (red)-labeled probe. They were also costained with DAPI (blue). The arrow indicates the FISH-positive position of Chromosome 12 (bottom right panel). Scale bar, 10 μm. B–E, Expression of Dock7, Rho GTPase, JNK1, MBS, EGFP, and actin in the tissues of 7-d-old Dock7 shRNA transgenic mice (TG) or nontransgenic littermates (NTG) tissues was confirmed using immunoblotting with each specific antibody. B, Extracts from the sciatic nerve tissues were immunoblotted with an anti-MPZ antibody.
Figure 6.
Figure 6.
Dock7 shRNA transgene promotes myelination by Schwann cells. A, Representative images of in vitro myelination from cultures established from a Dock7 shRNA transgenic mouse (TG) and a nontransgenic littermate (NTG). Cultures were costained with an anti-MBP antibody (red) and DAPI (blue) to observe myelination and total cell numbers, respectively. B, Representative images of in vitro myelination from cultures established from a Dock7 shRNA transgenic mouse with or without transfecting the plasmid encoding GFP-tagged shRNA-resistant Dock7. C, Expression of transfected Dock7 and the control actin is shown. Scale bar, 30 μm.
Figure 7.
Figure 7.
Cell number and migratory activity of Dock7 shRNA transgenic mouse Schwann cells. A, Embryonic Day 14.5 cross-sections along the spinal cord region (SC) and the ventral root (VR) from Dock7 shRNA transgenic mice (TG) and nontransgenic littermates (NTG) were stained with an anti-Sox10 antibody (red) to observe the total cell number of the Schwann cell lineage in the peripheral ganglia. The small letters ad are magnifications of the boxed areas (left and right large sections). The outlines of the DRG and VR are surrounded by dotted lines. Scale bars, 50 μm. B, Cross-sections of 7-d-old sciatic nerves in transgenic and nontransgenic mice were stained with DAPI (blue) to observe the total cell number. Scale bar, 100 μm. C, Schwann cells from transgenic and nontransgenic mice were treated with 10 ng/ml neuregulin-1 and 5 μm forskolin for 0–48 h and counted using a hemocytometer (n = 3). D, Schwann cell migration was assayed in the presence or absence of 10 ng/ml neuregulin-1 for 6 h using Boyden chambers. Migrating Schwann cells were fixed, stained with Giemsa solution, and counted (n = 3). E, F, Schwann cell reaggregates were placed onto live DRG axons and allowed to migrate for 6 h. Schwann cells were stained with an anti-p75NTR antibody (red) and the distance of migration from the center of the reaggregate was measured (indicated by dotted lines) (n = 3). Phase-contrast (PH) images are also shown. The dotted lines indicate the original size of the reaggregates or the outer line of migrating cells. Scale bar, 100 μm. Data were evaluated using one-way ANOVA (*p < 0.01).
Figure 8.
Figure 8.
Cell morphology of Dock7 shRNA transgenic mouse DRG neurons. DRG neurons from a Dock7 shRNA transgenic mouse (TG) and a nontransgenic littermate (NTG) were cultured for 2 d and stained with an anti-neurofilament antibody (red). Scale bar, 100 μm.
Figure 9.
Figure 9.
Dock7 knockdown in mice leads to enhanced sciatic nerve myelin thickness. A, Representative electron micrograph of sciatic nerve cross-sections in a 7-d-old Dock7 shRNA transgenic mouse (TG) or a nontransgenic littermate (NTG). Scale bar, 1 μm. B, To obtain statistical data, we calculated the g-ratio, that is, the numerical ratio of the diameter of the axon proper to the outer diameter of the myelinated fiber, for each axon. When a myelinated axon has a rhomboid-like form, its diameter is calculated as the average value between the longest diameter and the shortest one. Scatter plot of the g-ratio derived from electron micrographs of the sciatic nerves in transgenic mice (a total of 90 nerves in two independent mice) and nontransgenic mice (a total of 114 nerves in two independent mice) for each axonal size is shown. The average g-ratios are also shown. C, Data are presented in the form of relative distribution of g-ratios.
Figure 10.
Figure 10.
Electron micrographs of developing sciatic nerves. Representative electron micrographs of sciatic nerve cross-sections of shRNA transgenic mice (TG) or nontransgenic littermates (NTG) at 3 d old, 14 d old, and 1 month old. Scale bar, 5 μm. Scatter plots of the g-ratio derived from electron micrographs of the sciatic nerves in transgenic mice (a total of 70, 74, and 73 nerves in two independent mice at 7 d old, 14 d old, and 1 month old, respectively) and nontransgenic mice (a total of 87, 54, and 70 nerves in two independent mice at 7 d old, 14 d old, and 1 month old, respectively) for each axonal size are shown. The average g-ratios are also shown.
Figure 11.
Figure 11.
Effects of Dock7 knockdown in mice on signaling proteins controlling myelination. Sciatic nerve tissues at 1 d old, 6 d old, and 12 d old were lysed and immunoblotted with an antibody against Oct6 (n = 3) (A), Krox20 (n = 3) (B), neuregulin-1 (NRG1) (n = 3) (C), (pSer473)Akt1 and Akt1 (n = 3) (D), (pSer16)stathmin and stathmin (n = 3) (E), or actin (n = 3) (F). The active state of Akt1 is recognized with an anti-(pSer473)Akt1 antibody. Phosphorylation of stathmin at the Ser-16 position is mediated by Rac1/Cdc42 signaling. Proteins and their phosphorylation are shown as relative values. TG, Transgenic mice; NTG, nontransgenic mice. Data were evaluated using one-way ANOVA (*p < 0.01; **p < 0.02).
Figure 12.
Figure 12.
Dock7 knockdown in mice changes Rho GTPase signaling in sciatic nerves. A, B, D, Seven-day-old sciatic nerve tissues were lysed, affinity precipitated, and immunoblotted with an antibody against each small GTPase. Total small GTPase is also shown. C, Sciatic nerve tissue extracts were immunoprecipitated with an anti-JNK1 antibody and immunoblotted with an antibody against (pThr183/pTyr185)JNK. Total JNK1 is also shown. E, Sciatic nerve tissue extracts were immunoblotted with an antibody against (pT853)MBS or MBS. TG, Transgenic mice; NTG, nontransgenic mice.

Similar articles

Cited by

References

    1. Bar-Sagi D, Hall A. Ras and Rho GTPases: a family reunion. Cell. 2000;103:227–238. - PubMed
    1. Benninger Y, Thurnherr T, Pereira JA, Krause S, Wu X, Chrostek-Grashoff A, Herzog D, Nave KA, Franklin RJ, Meijer D, Brakebusch C, Suter U, Relvas JB. Essential and distinct roles for Cdc42 and Rac1 in the regulation of Schwann cell biology during peripheral nervous system development. J Cell Biol. 2007;177:1051–1061. - PMC - PubMed
    1. Blasius AL, Brandl K, Crozat K, Xia Y, Khovananth K, Krebs P, Smart NG, Zampolli A, Ruggeri ZM, Beutler BA. Mice with mutations of Dock7 have generalized hypopigmentation and white-spotting but show normal neurological function. Proc Natl Acad Sci U S A. 2009;106:2706–2711. - PMC - PubMed
    1. Bottenstein JE, Sato GH. Growth of a rat neuroblastoma cell line in serum-free supplemented medium. Proc Natl Acad Sci U S A. 1979;76:514–517. - PMC - PubMed
    1. Bunge RP. Expanding roles for the Schwann cell: ensheathment, myelination, trophism and regeneration. Curr Opin Neurobiol. 1993;3:805–809. - PubMed

Publication types

MeSH terms