

Neural basis of adaptive response time adjustment during saccade countermanding
- PMID: 21880921
- PMCID: PMC3173043
- DOI: 10.1523/JNEUROSCI.1868-11.2011
Neural basis of adaptive response time adjustment during saccade countermanding
Abstract
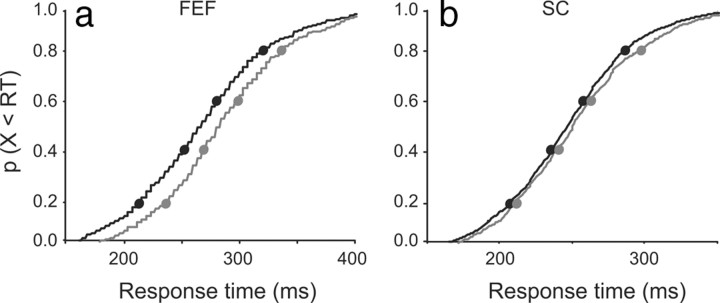
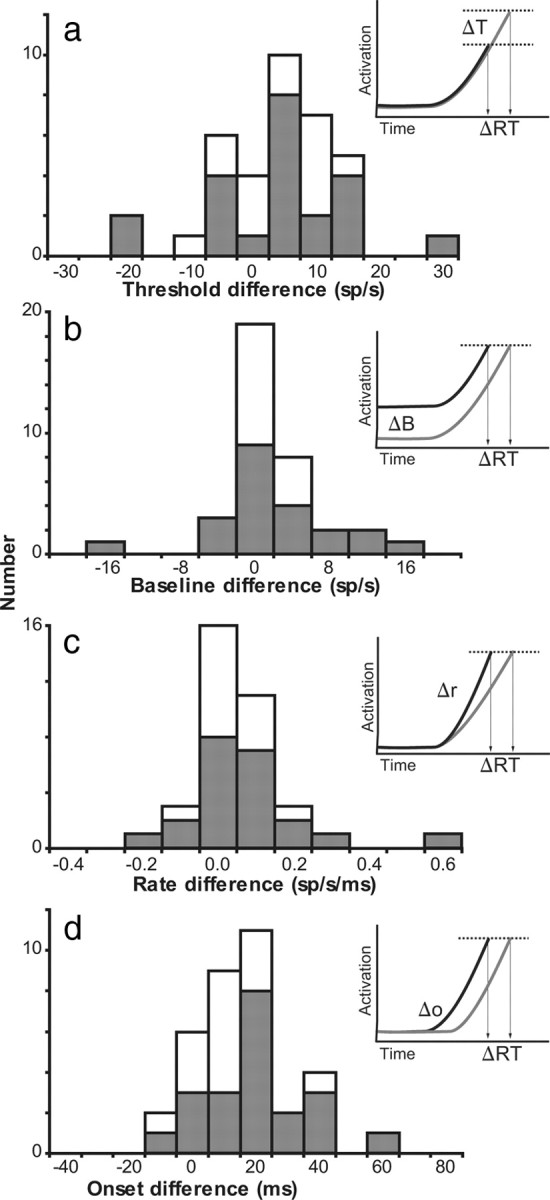
Humans and macaque monkeys adjust their response time adaptively in stop-signal (countermanding) tasks, responding slower after stop-signal trials than after control trials with no stop signal. We investigated the neural mechanism underlying this adaptive response time adjustment in macaque monkeys performing a saccade countermanding task. Earlier research showed that movements are initiated when the random accumulation of presaccadic movement-related activity reaches a fixed threshold. We found that a systematic delay in response time after stop-signal trials was accomplished not through a change of threshold, baseline, or accumulation rate, but instead through a change in the time when activity first began to accumulate. The neurons underlying movement initiation have been identified with stochastic accumulator models of response time performance. Therefore, this new result provides surprising new insights into the neural instantiation of stochastic accumulator models and the mechanisms through which executive control can be exerted.
Figures


Similar articles
-
Functional distinction between visuomovement and movement neurons in macaque frontal eye field during saccade countermanding.J Neurophysiol. 2009 Dec;102(6):3091-100. doi: 10.1152/jn.00270.2009. Epub 2009 Sep 23. J Neurophysiol. 2009. PMID: 19776364 Free PMC article.
-
Relation of frontal eye field activity to saccade initiation during a countermanding task.Exp Brain Res. 2008 Sep;190(2):135-51. doi: 10.1007/s00221-008-1455-0. Epub 2008 Jul 5. Exp Brain Res. 2008. PMID: 18604527 Free PMC article.
-
Influence of history on saccade countermanding performance in humans and macaque monkeys.Vision Res. 2007 Jan;47(1):35-49. doi: 10.1016/j.visres.2006.08.032. Epub 2006 Nov 1. Vision Res. 2007. PMID: 17081584 Free PMC article.
-
Role of frontal eye fields in countermanding saccades: visual, movement, and fixation activity.J Neurophysiol. 1998 Feb;79(2):817-34. doi: 10.1152/jn.1998.79.2.817. J Neurophysiol. 1998. PMID: 9463444
-
Microsaccade production during saccade cancelation in a stop-signal task.Vision Res. 2016 Jan;118:5-16. doi: 10.1016/j.visres.2014.10.025. Epub 2014 Nov 6. Vision Res. 2016. PMID: 25448116 Free PMC article. Review.
Cited by
-
Motor selection dynamics in FEF explain the reaction time variance of saccades to single targets.Elife. 2018 Apr 13;7:e33456. doi: 10.7554/eLife.33456. Elife. 2018. PMID: 29652247 Free PMC article.
-
The importance of decision onset.J Neurophysiol. 2016 Feb 1;115(2):643-61. doi: 10.1152/jn.00274.2015. Epub 2015 Nov 25. J Neurophysiol. 2016. PMID: 26609111 Free PMC article. Review.
-
Frontal Eye Field Inactivation Diminishes Superior Colliculus Activity, But Delayed Saccadic Accumulation Governs Reaction Time Increases.J Neurosci. 2017 Nov 29;37(48):11715-11730. doi: 10.1523/JNEUROSCI.2664-17.2017. Epub 2017 Oct 31. J Neurosci. 2017. PMID: 29089439 Free PMC article.
-
Functional architecture of executive control and associated event-related potentials in macaques.Nat Commun. 2022 Oct 21;13(1):6270. doi: 10.1038/s41467-022-33942-1. Nat Commun. 2022. PMID: 36271051 Free PMC article.
-
On the Neural and Mechanistic Bases of Self-Control.Cereb Cortex. 2019 Feb 1;29(2):732-750. doi: 10.1093/cercor/bhx355. Cereb Cortex. 2019. PMID: 29373633 Free PMC article.
References
-
- Bogacz R, Brown E, Moehlis J, Holmes P, Cohen JD. The physics of optimal decision making: a formal analysis of models of performance in two-alternative forced-choice tasks. Psychol Rev. 2006;113:700–765. - PubMed
-
- Boucher L, Palmeri TJ, Logan GD, Schall JD. Inhibitory control in mind and brain: an interactive race model of countermanding saccades. Psychol Rev. 2007;114:376–397. - PubMed
-
- Brown SD, Heathcote A. The simplest complete model of choice response time: linear ballistic accumulation. Cogn Psychol. 2008;57:153–178. - PubMed
Publication types
MeSH terms
Grants and funding
LinkOut - more resources
Full Text Sources