. 2011 Aug 31;31(35):12674-82.
doi: 10.1523/JNEUROSCI.1856-11.2011.

Network rhythms influence the relationship between spike-triggered local field potential and functional connectivity

Affiliations

Network rhythms influence the relationship between spike-triggered local field potential and functional connectivity

Supratim Ray et al. J Neurosci. .

Abstract

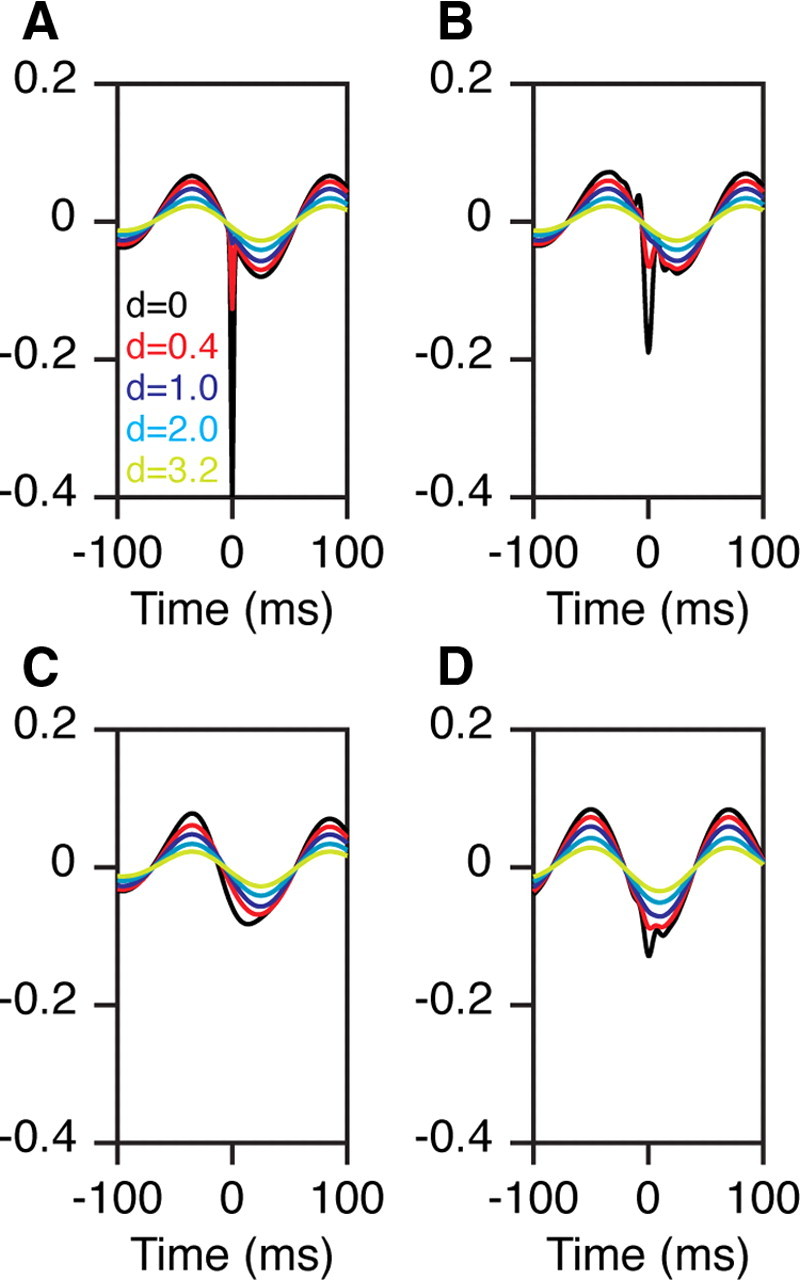
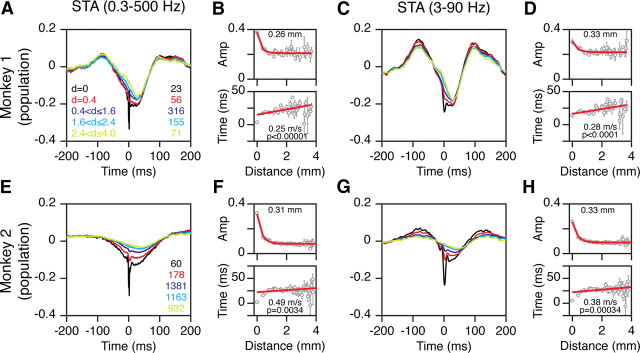
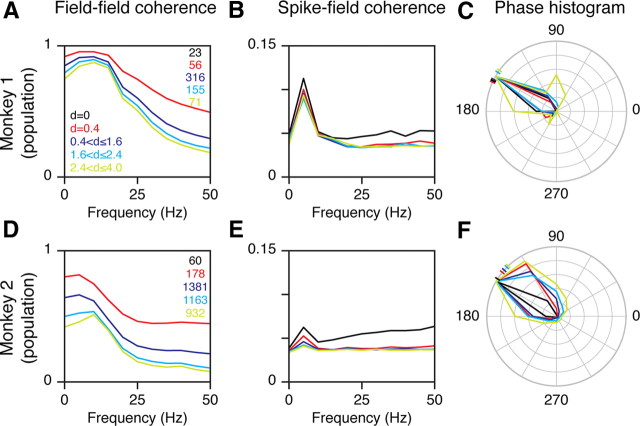
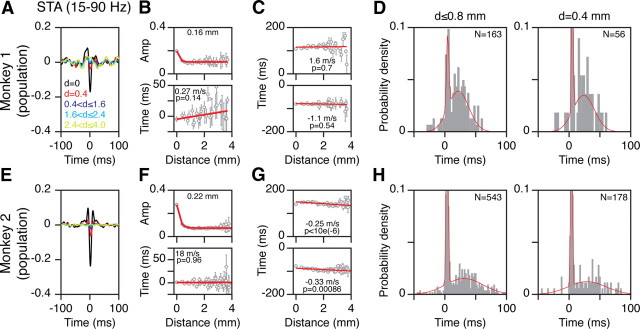
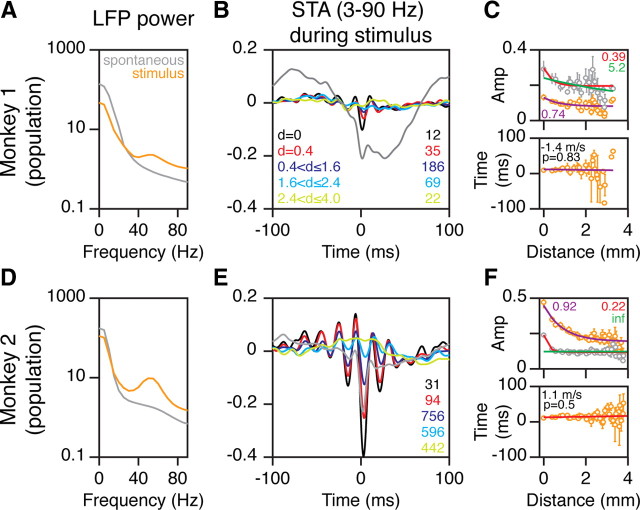
Characterizing the functional connectivity between neurons is key for understanding brain function. We recorded spikes and local field potentials (LFPs) from multielectrode arrays implanted in monkey visual cortex to test the hypotheses that spikes generated outward-traveling LFP waves and the strength of functional connectivity depended on stimulus contrast, as described recently. These hypotheses were proposed based on the observation that the latency of the peak negativity of the spike-triggered LFP average (STA) increased with distance between the spike and LFP electrodes, and the magnitude of the STA negativity and the distance over which it was observed decreased with increasing stimulus contrast. Detailed analysis of the shape of the STA, however, revealed contributions from two distinct sources-a transient negativity in the LFP locked to the spike (∼0 ms) that attenuated rapidly with distance, and a low-frequency rhythm with peak negativity ∼25 ms after the spike that attenuated slowly with distance. The overall negative peak of the LFP, which combined both these components, shifted from ∼0 to ∼25 ms going from electrodes near the spike to electrodes far from the spike, giving an impression of a traveling wave, although the shift was fully explained by changing contributions from the two fixed components. The low-frequency rhythm was attenuated during stimulus presentations, decreasing the overall magnitude of the STA. These results highlight the importance of accounting for the network activity while using STAs to determine functional connectivity.


Figures

Figure 1.
Figure 1.
A mechanism that explains both the shift in the negative peak of the STA as well as its onset before time 0. A, The LFP has an ongoing oscillation at 8 Hz and spikes tend to occur 25 ms before its negative peak. The STA of the reference electrode (black trace) shows the contribution of the spike (sharp Gaussian with an SD of 2 ms centered at 0) and of the 8 Hz rhythm. The degree of phase locking determines the relative magnitudes of the two sources (arbitrarily chosen to be 0.4 and 0.08 for the spike transient and alpha rhythm). These two sources fall off at different rates with distance (d), depending on the degree of synchronization in the spikes and phase consistency of the alpha rhythm (space constants arbitrarily chosen to be 0.3 and 3 mm for the spike transient and alpha rhythm). B, Same data as in A, but filtered between 3 and 90 Hz, which decreases the spike transient but not the alpha rhythm. C, Same as in A, filtered between 3 and 20 Hz. D, STA (filtered between 3 and 90 Hz) for which spikes occur 10 ms before the negative peak of the rhythm. The spike transient (before filtering) and the rhythm both have a magnitude of 0.1.
Figure 2.
Figure 2.
Population STA analysis during the prestimulus period. A, Average data of 23 reference sites in Monkey 1, as a function of distance between spike and LFP electrodes (indicated on the left), when raw LFP (filtered between 0.3 and 500 Hz) was used. The number of STAs averaged for each trace is shown on the right. B, The top plot shows the peak negative amplitude as a function of cortical distance between spike and LFP electrodes. The legend shows the space constant. The lower plot shows the time-to-peak negativity as a function of distance. The inverse of the slope (speed of propagation) and the significance of the regression fit are shown in the legend. C, D, Same as in A and B after first filtering the LFPs between 3 and 90 Hz. E–H, Same as in A–D for 60 reference electrodes in Monkey 2.
Figure 3.
Figure 3.
Coherence analysis during prestimulus period. A, Field–field coherence between LFPs recorded from the spike electrode and other electrodes, for different interelectrode distances, for 23 spike electrodes in Monkey 1 (same format as Fig. 2). The coherence of the reference electrode with itself (black trace) is not visible because it is unity at all frequencies. B, Spike-field coherence between the spikes recorded from the reference electrode and LFP recorded from other electrodes. C, Normalized histogram of the phase values at 5 Hz, obtained from the spike-field coherence analysis shown in B. The ticks on the left show the circular mean of the phase values for each interelectrode range. D–F, Same as in A–C for 60 reference electrodes in Monkey 2.
Figure 4.
Figure 4.
No traveling waves in V1. A, B, Same as the plots shown in Figure 2, A and B, but for LFP filtered between 15 and 90 Hz. C, Top plot shows the time of the positive peak between 0 and 200 ms in the STA filtered between 3 and 90 Hz (as shown in Fig. 2C), as a function of cortical distance between spike and LFP electrodes. Lower plot shows the positive peak in the STA between −200 and 0 ms. D, Histogram of time-to-peak negativity values for all interelectrode distances up to 0.8 mm (left) or at 0.4 mm (right). The red lines show the best-fitting bimodal Gaussian distribution (see Results for details). For the right plot, the peak near 0 ms has a value of 0.16 (truncated at 0.1 to highlight the second peak). E–H, Same as in A–D for 60 electrodes in Monkey 2. For the histograms (H), the peaks of the Gaussians near time 0 had values of 0.25 and 0.43, which were truncated at 0.1 to highlight the second peak near ∼25 ms.
Figure 5.
Figure 5.
Comparison of STAs during prestimulus versus stimulus-driven states. A, Average power spectra of LFP segments taken between 200 and 400 ms after stimulus onset (orange trace) and prestimulus periods (300–100 ms before stimulus onset; gray trace) for 12 electrodes in Monkey 1. Power is given in units of microvolt square per hertz [(μV)2 Hz−1]. B, Average STAs obtained from spikes recorded in the driven state for different interelectrode ranges (same format as in Fig. 2C). The gray trace shows the STA for the reference electrode (d = 0) using spikes recorded from the prestimulus condition. C, Amplitude versus distance (upper plot) for both the driven (orange circles; space constant shown in violet) and prestimulus conditions (gray; space constants shown in red and green; see text for details). The bottom row shows the time of the negative peak during the driven condition as a function of cortical distance from the spike electrode. The legend indicates the speed of propagation and the significance of the regression fit. D–F, Same as in A–C for 31 electrodes in Monkey 2.

References

    1. Bartos M, Vida I, Jonas P. Synaptic mechanisms of synchronized gamma oscillations in inhibitory interneuron networks. Nat Rev Neurosci. 2007;8:45–56. - PubMed
    1. Belitski A, Gretton A, Magri C, Murayama Y, Montemurro MA, Logothetis NK, Panzeri S. Low-frequency local field potentials and spikes in primary visual cortex convey independent visual information. J Neurosci. 2008;28:5696–5709. - PMC - PubMed
    1. Belitski A, Panzeri S, Magri C, Logothetis NK, Kayser C. Sensory information in local field potentials and spikes from visual and auditory cortices: time scales and frequency bands. J Comput Neurosci. 2010;29:533–545. - PMC - PubMed
    1. Berens P, Velasco MJ. Tübingen, Germany: Max Planck Institute for Biological Cybernetics; 2009. The circular statistics toolbox for Matlab. Technical report no. 184.
    1. Berens P, Keliris GA, Ecker AS, Logothetis NK, Tolias AS. Comparing the feature selectivity of the gamma-band of the local field potential and the underlying spiking activity in primate visual cortex. Front Syst Neurosci. 2008;2:2. - PMC - PubMed

Publication types

LinkOut - more resources