. 2011 Aug 31;31(35):12683-94.
doi: 10.1523/JNEUROSCI.1654-11.2011.

Frequency of subthreshold oscillations at different membrane potential voltages in neurons at different anatomical positions on the dorsoventral axis in the rat medial entorhinal cortex

Affiliations

Frequency of subthreshold oscillations at different membrane potential voltages in neurons at different anatomical positions on the dorsoventral axis in the rat medial entorhinal cortex

Motoharu Yoshida et al. J Neurosci. .

Abstract

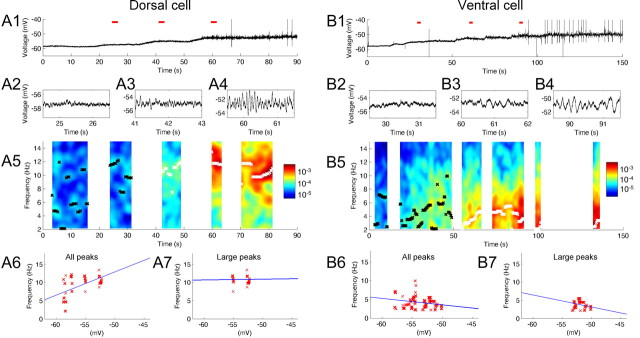
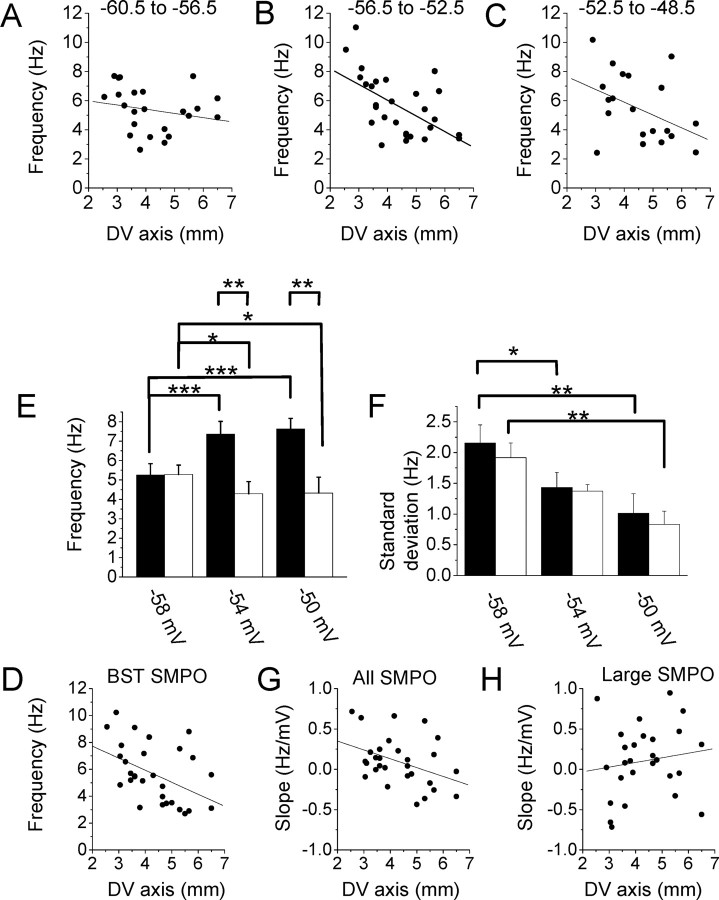
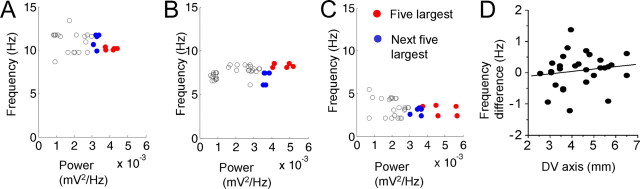
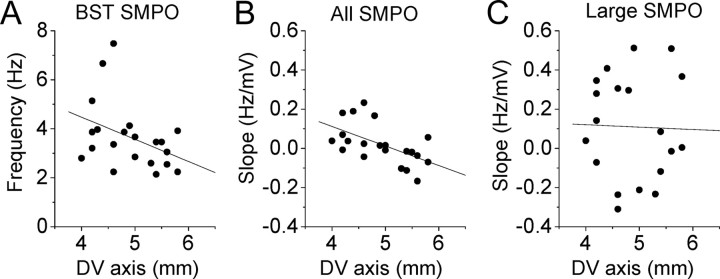
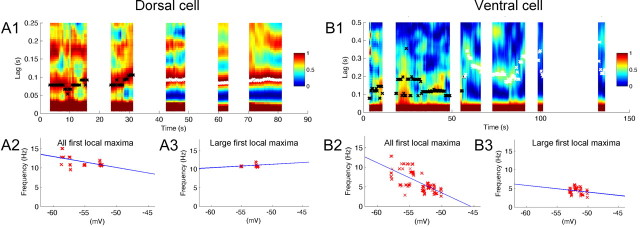
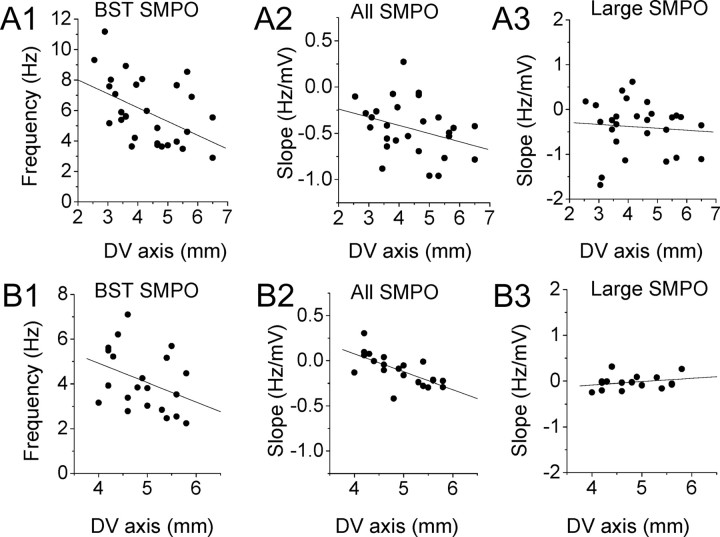
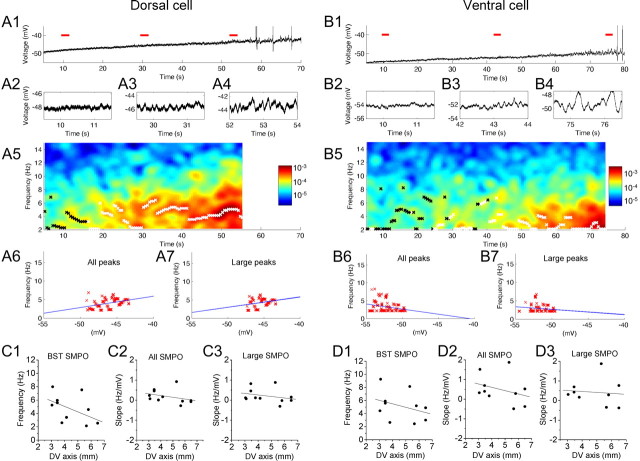
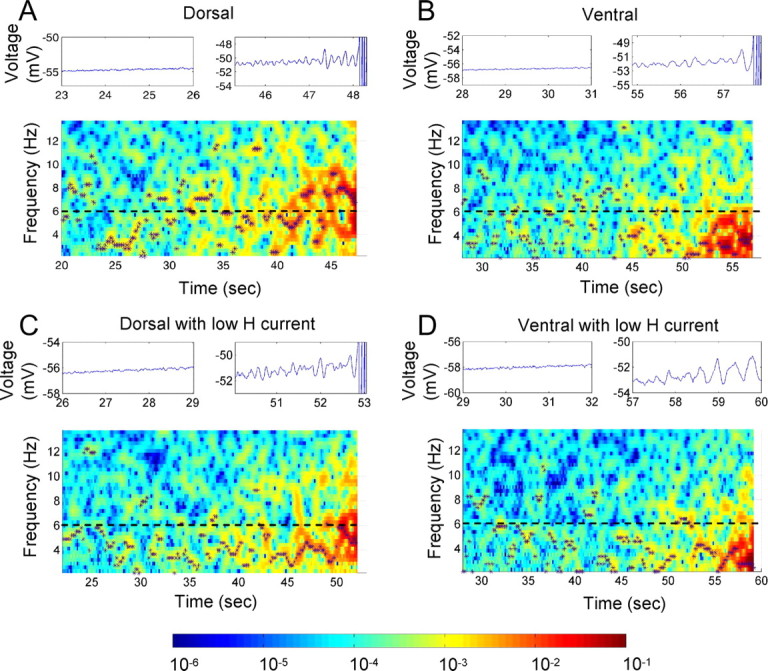
Neurons from layer II of the medial entorhinal cortex show subthreshold membrane potential oscillations (SMPOs) which could contribute to theta-rhythm generation in the entorhinal cortex and to generation of grid cell firing patterns. However, it is unclear whether single neurons have a fixed unique oscillation frequency or whether their frequency varies depending on the mean membrane potential in a cell. We therefore examined the frequency of SMPOs at different membrane potentials in layer II stellate-like cells of the rat medial entorhinal cortex in vitro. Using whole-cell patch recordings, we found that the fluctuations in membrane potential show a broad band of low power frequencies near resting potential that transition to more narrowband oscillation frequencies with depolarization. The transition from broadband to narrowband frequencies depends on the location of the neuron along the dorsoventral axis in the entorhinal cortex, with dorsal neurons transitioning to higher-frequency oscillations relative to ventral neurons transitioning to lower-frequency oscillations. Once SMPOs showed a narrowband frequency, systematic frequency changes were not observed with further depolarization. Using a Hodgkin-Huxley-style model of membrane currents, we show that differences in the influence of depolarization on the frequency of SMPOs at different dorsal to ventral positions could arise from differences in the properties of the h current. The properties of frequency changes in this data are important for evaluating models of the generation of grid cell firing fields with different spacings along the dorsal-to-ventral axis of medial entorhinal cortex.


Figures

Figure 1.
Figure 1.
Frequency of subthreshold membrane potential oscillations at different mean membrane potential voltages. As membrane potential is depolarized, dorsal neurons transition to higher frequencies, and ventral neurons transition to lower frequencies. A1–A7, A dorsal neuron. B1–B7, A ventral neuron. A1, B1, Individual traces illustrate membrane potential oscillations as the mean membrane potential voltage is manipulated by stepwise increases in current injection. Traces corresponding to three red lines are magnified in A2–A4 and B2–B4. A5, B5, Color plot of power spectrum of SMPO frequencies obtained using FFT. Peaks are shown with black (power, <0.0001 mV2/Hz) and white (power, ≥0.0001 mV2/Hz) crosses superimposed on the color map. In a dorsal neuron, transitions from broadband oscillation frequencies to a single, higher band of oscillations around 10 Hz can be seen. The color bars show the power spectrum scale in mV2/Hz. A6, B6, All the peaks (A5, B5, black and white crosses) of the power spectrum replotted as a function of average membrane potential of the corresponding trace. A7, B7, Only large-amplitude peaks of the power spectrum (A5, B5, white crosses) plotted as a function of the average membrane potential of the corresponding trace.
Figure 2.
Figure 2.
Trends of transition of SMPO frequency in populations of cells. A–C, The mean SMPO frequency of individual cells at the membrane potential ranges between −60.5 and −56.5 mV (linear regression, r = −0.21; p = 0.31; n = 24; A), −56.5 and −52.5 mV (linear regression, r = −0.56; p = 0.0016; n = 29; B), and −52.5 and −48.5 mV (linear regression, r = −0.42; p = 0.061; n = 21; C). D, Located below E. The BST SMPO frequency of individual cells (see Materials and Methods) along the dorsoventral (DV) axis (linear regression, r = −0.45; p = 0.014; n = 30). E, Mean peak frequency of oscillations measured at three different membrane potential ranges within cells that were recorded from all of the three ranges. Cells were grouped into population of dorsal cells (filled bars; n = 7) and ventral cells [open bars; n = 7; two-way repeated measures ANOVA, dorsoventral axis (dorsal and ventral groups), F(1,24) = 6.41, p < 0.05; membrane potential (−60, −56, and −52 mV), F(2,24) = 3.86, p < 0.05; interaction, F(2,24) = 24.04, p < 0.001]. F, Standard deviation of SMPO frequencies from the same group of cells at three different membrane potential ranges [two-way repeated measures ANOVA, dorsoventral axis (dorsal and ventral groups), F(1,24) = 0.38, p = 0.55; membrane potential (−60, −56, and −52 mV), F(2,24) = 15.27, p < 0.001; interaction, F(2,24) = 0.11, p = 0.90]. G, Slope of FFT peak frequency versus membrane potential in individual neurons at different dorsal to ventral positions using all traces (linear regression, r = −0.40; p = 0.029; n = 30). H, Slope of FFT peak frequency versus membrane potential in individual neurons at different dorsal to ventral positions using only traces with large SMPOs (linear regression, r = 0.20; p = 0.29; n = 28). Significance levels in E and F: *p < 0.05, **p < 0.01, ***p < 0.001.
Figure 3.
Figure 3.
Effects of SMPO power on SMPO frequency. A, SMPO power versus frequency for all the windows where FFT was applied at the most depolarized level of the dorsal neuron shown in Figure 1A. Each circle corresponds to one window where choices of windows were restricted to the time after ∼57 s. The red circles correspond to windows with five largest powers, and the blue circles correspond to windows with the next five largest powers. B, C, Additional examples of cells from an intermediate level of the dorsoventral (DV) axis (B) and the ventral level (C). D, The difference between averages of the five largest and the next largest frequencies plotted as a function of the dorsoventral axis for all cells (linear regression, r = 0.15; p = 0.41; n = 30).
Figure 4.
Figure 4.
Trends of transition of SMPO frequency in additional set of cells. A, The BST SMPO frequency of individual cells in an additional data set along the dorsoventral (DV) axis (linear regression, r = −0.39; p = 0.083; n = 21). B, Slope of SMPO frequency versus membrane potential using all traces in the additional data set (linear regression, r = −0.56; p = 0.0078; n = 21). C, Slope of SMPO frequency versus membrane potential using only traces with large SMPO amplitudes (linear regression, r = −0.027; p = 0.91; n = 19).
Figure 5.
Figure 5.
Autocorrelation analysis of SMPO frequency change with depolarization. A1–A3, A dorsal neuron (same cell as in Fig. 1A). B1–B3, A ventral neuron (same cell as in Fig. 1B). A1, B1, Color plot of autocorrelogram and detected peak superposed as black (amplitude, <0.005 mV) and white crosses (amplitude, >0.005 mV), respectively. The autocorrelogram from each window was normalized to the range 0 to 1 for clarity of the color plot. The color bars show the scale after normalization. A2, B2, All the first local maxima (black and white crosses) of the autocorrelation converted to frequency and replotted as a function of the average membrane potential of the corresponding trace. A3, B3, Only large-amplitude first local maxima (white crosses in A2, B2) plotted as a function of average membrane potential of the corresponding trace.
Figure 6.
Figure 6.
Trends of transition of SMPO frequency in populations of cells using autocorrelation. A1–A3, Autocorrelation analysis for same data set as in Figure 2A–H. B1–B3, Autocorrelation analysis for additional data set in Figure 4A–C. A1, B1, The BST SMPO frequency of individual cells (see Materials and Methods) along the dorsoventral (DV) axis. A2, B2, Slope of autocorrelation frequency versus membrane potential in individual neurons at different dorsal to ventral positions. A3, B3, Similar to A2 and B2 but only with traces with large SMPOs. Linear regression values are as follows: A1, r = −0.47, p = 0.0095, n = 30; A2, r = −0.33, p = 0.091, n = 28; A3, r = −0.084, p = 0.67, n = 28; B1, r = −0.37, p = 0.10, n = 21; B2, r = −0.68, p = 0.0007, n = 21; B3, r = 0.26, p = 0.32, n = 16.
Figure 7.
Figure 7.
Frequency changes during ramp stimulation. A1–A7, A dorsal neuron. B1–B7, A ventral neuron. A1, B1, Example of membrane potential oscillation response during an increasing ramp of current injection. A2–A4, B2–B4, Magnified trace from A1 and B1, respectively. Each magnified trace corresponds to time indicated by the red lines in A1 and B1. A5, B5, Color map of power spectrum obtained by FFT using the traces shown in A1 and B1. A6, B6, All the peaks (black and white crosses in A5, B5) of the power spectrum replotted as a function of the average membrane potential of the corresponding trace. A7, B7, Only large-amplitude peaks of the power spectrum (white crosses in A5, B5) plotted as a function of the average membrane potential of the corresponding trace. C1, D1, The BST SMPO frequency of individual cells (see Materials and Methods) along the dorsoventral axis with decreasing and increasing ramp protocols, respectively (linear regression, C1, r = −0.53, p = 0.092, n = 11; D1, r = −0.34, p = 0.34, n = 10). C2, D2, Slope of peak frequency to membrane potential calculated from the ramp stimulus for neurons at different dorsal to ventral positions using the decreasing component of the ramp (C2, down) and the increasing ramp (D2, up; linear regression, C2, r = −0.35, p = 0.30, n = 11; D2, r = −0.32, p = 0.36, n = 10). C3, D3, Similar slope plots using only traces with large SMPOs with increasing and decreasing ramp protocols, respectively (linear regression, C3, r = −0.28, p = 0.40, n = 11; D3, r = −0.10, p = 0.80, n = 9).
Figure 8.
Figure 8.
Ramp simulation results for the single-compartment model medial entorhinal cortex II stellate cell in four parameter configurations. A depolarizing direct current was applied, linearly increasing from rest potential until threshold was reached and spikes were observed, and the PSD (in square millivolts per hertz) of the resulting membrane potential was calculated over the simulation time before the first spike was observed. A–D, The four conditions were the h current fast time constant model for a typical dorsal cell (A) and for a typical ventral cell (B), using parameters from voltage-clamp data (Giocomo and Hasselmo, 2008), and (C) h channel density reduced by half for the dorsal fast time constant model and (D) for the ventral time constant model. For each ramp, the top left plot shows a segment of the voltage trace in the broadband region, and the top right plot shows a segment of the voltage trace for the same duration as the left plot but in the narrowband region of high depolarization up to and including the first spike events. In the PSD spectrograms, the local maximum PSD value at each analysis time interval is marked by an asterisk. The color bar shows the PSD scale in mV2/Hz. The h channel conductance density for A and B is 0.169 mS/cm2, and for C and D it is 0.0845 mS/cm2.

Similar articles

Cited by

References

    1. Acker CD, Kopell N, White JA. Synchronization of strongly coupled excitatory neurons: relating network behavior to biophysics. J Comput Neurosci. 2003;15:71–90. - PubMed
    1. Alonso A, Klink R. Differential electroresponsiveness of stellate and pyramidal-like cells of medial entorhinal cortex layer II. J Neurophysiol. 1993;70:128–143. - PubMed
    1. Alonso A, Llinas RR. Subthreshold Na-dependent theta-like rhythmicity in stellate cells of entorhinal cortex layer II. Nature. 1989;342:175–177. - PubMed
    1. Barry C, Hayman R, Burgess N, Jeffery KJ. Experience-dependent rescaling of entorhinal grids. Nat Neurosci. 2007;10:682–684. - PubMed
    1. Blair HT, Gupta K, Zhang K. Conversion of a phase- to a rate-coded position signal by a three-stage model of theta cells, grid cells, and place cells. Hippocampus. 2008;18:1239–1255. - PMC - PubMed

Publication types

LinkOut - more resources