. 2011 Nov;157(3):1151-62.
doi: 10.1104/pp.111.185066. Epub 2011 Aug 31.

Key proliferative activity in the junction between the leaf blade and leaf petiole of Arabidopsis

Affiliations

Key proliferative activity in the junction between the leaf blade and leaf petiole of Arabidopsis

Yasunori Ichihashi et al. Plant Physiol. 2011 Nov.

Abstract

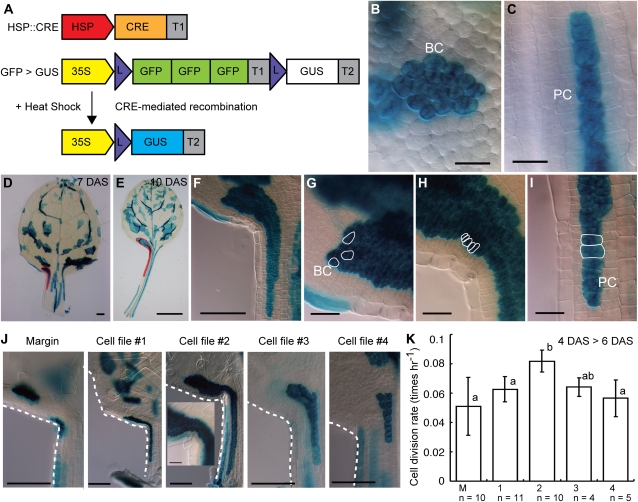
Leaves are the most important, fundamental units of organogenesis in plants. Although the basic form of a leaf is clearly divided into the leaf blade and leaf petiole, no study has yet revealed how these are differentiated from a leaf primordium. We analyzed the spatiotemporal pattern of mitotic activity in leaf primordia of Arabidopsis (Arabidopsis thaliana) in detail using molecular markers in combination with clonal analysis. We found that the proliferative zone is established after a short interval following the occurrence of a rod-shaped early leaf primordium; it is separated spatially from the shoot apical meristem and seen at the junction region between the leaf blade and leaf petiole and produces both leaf-blade and leaf-petiole cells. This proliferative region in leaf primordia is marked by activity of the ANGUSTIFOLIA3 (AN3) promoter as a whole and seems to be differentiated into several spatial compartments: activities of the CYCLIN D4;2 promoter and SPATULA enhancer mark parts of it specifically. Detailed analyses of the an3 and blade-on-petiole mutations further support the idea that organogenesis of the leaf blade and leaf petiole is critically dependent on the correct spatial regulation of the proliferative region of leaf primordia. Thus, the proliferative zone of leaf primordia is spatially differentiated and supplies both the leaf-blade and leaf-petiole cells.


Figures

Figure 1.
Figure 1.
Characterization of the leaf blade and leaf petiole. A, Cleared mature first leaf harvested at 20 DAS. The arrow indicates the leaf blade/petiole junction region. B to H, Adaxial epidermal surface (B, D, and G) and paradermal views of palisade cells (C, E, and H). The leaf blade region (B and C), leaf blade/petiole junction region (D and E), and leaf petiole region (G and H) are shown. F shows the epidermal surface of the margin at the leaf blade/petiole junction region. Bars = 1 mm (A) and 100 μm (B–H).
Figure 2.
Figure 2.
Development of the leaf blade and leaf petiole. A to H are roughly arranged in accordance with the developmental stages. A, B, D, and E, mPS-PI-stained shoot apex and leaf primordia showing cell arrangements. A and B, Shoot apex at 2 DAS. Optical sections in B were made from the regions indicated by the green lines in A, the top in B from the left line in A, and the bottom in B from the right line in A. LP, Leaf primordium; CZ, central zone of the SAM; PZ, peripheral zone of the SAM. Asterisks indicate large leaf primordium cells. D, Palisade layers in the first set of leaf primordia harvested at 3 DAS. a, Apical domain; b, basal domain. E, Palisade layers in the first set of leaf primordia harvested at sequential developmental stages from 2.5 to 4 DAS. C, F, G, H, and I, pCYCB1;1::Dbox::GUS expression pattern shown as blue staining, in a cleared first set of leaf primordia, harvested at 3 DAS (C), 4 DAS (F), 6 DAS (G), and 7 DAS (H and I). The brackets in E show establishment of the leaf blade/petiole junction region in terms of anatomy. The proliferative region is shown with a bracket in H. I, Magnified view of the leaf blade/petiole junction region in H. Outlines of several cells are traced with black lines. J, Mitotic index (frequency of mitotic cells) and cell size (cell area) along the proximal-distal axis at 7 DAS. Different letters indicate significant differences between them (P < 0.05, Scheffe method). More than 20 leaf primordia were investigated. To quantify cell size, more than 50 palisade cells in the leaf blade and all palisade cells on two cell files next to marginal cells in the leaf petiole were examined in each leaf. Bars = 50 μm (B–F) and 100 μm (G–I).
Figure 3.
Figure 3.
Cell lineage of leaf-blade and leaf-petiole cells. A, Schematic drawing of the CRE/lox system. Expression of CRE recombinase was under the control of the heat shock promoter (HSP). 3×GFP was placed downstream of a 35S promoter (35S) between two CRE-targeting lox sites (L). GUS was induced after heat shock-dependent recombination by CRE recombinase. T1 and T2 represent the nopaline synthase and 35S terminators, respectively. Colored rectangles depict active genes. B, C, and F to J, Palisade layer in a cleared first set of leaf primordia at 7 DAS. Heat shock (37°C, 90 min, at 4 DAS)-induced sectors of GUS-positive cells are visualized as blue staining. B and C, Magnified views of the sector observed in the leaf blade region (B) and leaf petiole region (C). F to I, Magnified views of the whole sector (F) and the apical (G), middle (H), and basal (I) regions of the sector traced with a red line in D. Outlines of several typical cell shapes are traced with white lines in G to I. BC, Leaf-blade cell; PC, leaf-petiole cell. D and E, Whole images of a cleared first set of leaf primordia at 7 DAS (D) and 10 DAS (E). The outline of a single sector is traced with red lines. J, Magnified views of the leaf blade/petiole junction region. The inset shows a magnified view of the sector. K, Average cell division rate in each cell file. Different letters indicate significant differences (P < 0.05, Tukey’s honestly significant difference). Bars = 25 μm (B, C, G–I, and inset in J), 100 μm (D, F, and I), and 1 mm (E).
Figure 4.
Figure 4.
Active proliferation in the leaf blade/petiole junction region. A, DNA replication/synthesis in S-phase cells visualized by an EdU detection system. Green signals in nuclei indicate incorporations of EdU. B, G2/M-phase cells visualized by pCYCB1;1::Dbox::GUS marker as blue staining. C, New formation of cell walls visualized by staining with aniline blue. Bright blue lines indicate new cell walls that were made in late M phase to early G1 phase. New cell walls in the leaf blade/petiole junction are shown by arrows. All photographs show the first set of leaf primordia harvested at 7 DAS, with the same magnification. Bar = 100 μm.
Figure 5.
Figure 5.
Molecularly defined zones in the proliferative region of leaf primordia. pAN3::GUS (A), GUS in enhancer trap line 576 (B), and pCYCD4;2::EGFP::GUS (C) expression patterns are shown as blue staining or green signals for the first set of leaf primordia harvested at 6 DAS. Magnified views of the leaf blade/petiole junction region are shown in insets in B and C. Outlines of the leaf margins are traced with black lines. Bars = 100 μm and 50 μm (insets).
Figure 6.
Figure 6.
Characterization of the an3 mutant. A to C, pCYCD4;2::EGFP::GUS expression patterns are shown as blue staining for the first set of leaf primordia of the wild type (A) and the an3-4 mutant (B and C). Developmental stages in B and C correspond to earlier and later than the stage shown in A, respectively. D, First set of mature leaves from the wild type and an3-4. Incisions were made to flatten the curled leaves. E, The area (white bars) and palisade cell number (gray bars) in the leaf blade of wild-type and an3-4 plants. F, The length (white bars) and palisade cell number per cell file (gray bars) in the leaf petiole of wild-type and an3-4 plants. The first set of leaves from plants at 20 DAS was examined (n = 10; mean ± sd). Data significantly different from those of the wild type are indicated by asterisks (* P < 0.05, ** P < 0.01, Student’s t test). Bars = 100 μm (A–C) and 1 mm (D).
Figure 7.
Figure 7.
Characterization of the bop1 bop2 double mutant. A, First mature leaves of the wild type and bop1 bop2 harvested at 20 DAS. B and C, mPS-PI-stained palisade layers in the first set of leaf primordia of bop1 bop2 harvested at 3 DAS (B) and 4 DAS (C). Regions shown with brackets correspond to the leaf blade/petiole junction region that is expected to be established in wild-type leaf primordia (compare with Fig. 2E). D, F and G, pAN3::GUS expression patterns of the wild type and bop1 bop2 shown as blue staining in a cleared first set of leaf primordia at 3 DAS (D), 7 DAS in the wild type (F), and 9 DAS in bop1 bop2 (G). Dashed lines indicate the leaf base. E, First set of leaf primordia of the wild type and bop1 bop2 harvested at 5 DAS. So-called stipules, as markers of leaf base identity, are shown by asterisks. H, Cleared first mature leaf of bop1 bop2 harvested at 20 DAS. The inset shows a magnified view of the leaf-petiole-like region indicated by the box. Arrows indicate lateral veins. I and J, Epidermal (I) and palisade (J) layers in the leaf-petiole-like region of the first set of mature leaves of bop1 bop2 harvested at 20 DAS. Bars = 1 cm (A), 50 μm (B and C), 100 μm (D, F, G, I, and J), 10 μm (E), 1 mm (H), and 500 μm (inset in H).
Figure 8.
Figure 8.
Model for the proliferative region of leaf primordia. The schematic diagram summarizes functions and spatial differentiation of the proliferative region of leaf primordia. The proliferative region is maintained at the junction region between the leaf blade and the leaf petiole and supplies both leaf-blade and leaf-petiole cells. Colors are as follows: orange, pAN3 expression region; red, pCYCD4;2 expression region; blue, SPT enhancer expression region.

Similar articles

Cited by

References

    1. Anastasiou E, Kenz S, Gerstung M, MacLean D, Timmer J, Fleck C, Lenhard M. (2007) Control of plant organ size by KLUH/CYP78A5-dependent intercellular signaling. Dev Cell 13: 843–856 - PubMed
    1. Autran D, Jonak C, Belcram K, Beemster GT, Kronenberger J, Grandjean O, Inzé D, Traas J. (2002) Cell numbers and leaf development in Arabidopsis: a functional analysis of the STRUWWELPETER gene. EMBO J 21: 6036–6049 - PMC - PubMed
    1. Campisi L, Yang Y, Yi Y, Heilig E, Herman B, Cassista AJ, Allen DW, Xiang H, Jack T. (1999) Generation of enhancer trap lines in Arabidopsis and characterization of expression patterns in the inflorescence. Plant J 17: 699–707 - PubMed
    1. Clough SJ, Bent AF. (1998) Floral dip: a simplified method for Agrobacterium-mediated transformation of Arabidopsis thaliana. Plant J 16: 735–743 - PubMed
    1. Dengler NG, Tsukaya H. (2001) Leaf morphogenesis in dicotyledons: current issues. Int J Plant Sci 162: 459–464

Publication types

Substances