. 2011 Nov;157(3):1128-37.
doi: 10.1104/pp.111.181792. Epub 2011 Aug 31.

Molecular dissection of the roles of phytochrome in photoperiodic flowering in rice

Affiliations

Molecular dissection of the roles of phytochrome in photoperiodic flowering in rice

Asami Osugi et al. Plant Physiol. 2011 Nov.

Abstract

Phytochromes mediate the photoperiodic control of flowering in rice (Oryza sativa), a short-day plant. Recent molecular genetics studies have revealed a genetic network that enables the critical daylength response of florigen gene expression. Analyses using a rice phytochrome chromophore-deficient mutant, photoperiod sensitivity5, have so far revealed that within this network, phytochromes are required for expression of Grain number, plant height and heading date7 (Ghd7), a floral repressor gene in rice. There are three phytochrome genes in rice, but the roles of each phytochrome family member in daylength response have not previously been defined. Here, we revealed multiple action points for each phytochrome in the critical daylength response of florigen expression by using single and double phytochrome mutant lines of rice. Our results show that either phyA alone or a genetic combination of phyB and phyC can induce Ghd7 mRNA, whereas phyB alone causes some reduction in levels of Ghd7 mRNA. Moreover, phyB and phyA can affect Ghd7 activity and Early heading date1 (a floral inducer) activity in the network, respectively. Therefore, each phytochrome gene of rice has distinct roles, and all of the phytochrome actions coordinately control the critical daylength response of florigen expression in rice.


Figures
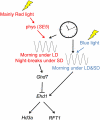
Figure 1.
Figure 1.
Previous model of daylength measurement in rice. Red and blue lines indicate red- and blue-light-mediated responses, respectively. According to this model, there are two gate mechanisms in rice: Ghd7 induction by red light both in morning under LD and at midnight with night break under SD and Ehd1 induction by blue light around dawn. In this model, phytochromes are required only for Ghd7 induction. This model was based on data reported in Itoh et al. (2010).
Figure 2.
Figure 2.
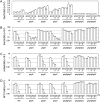
Expression of Ghd7, Ehd1, Hd3a, and RFT1 in all possible single and double phytochrome mutants of rice under various daylength conditions. A to D, Quantitative reverse transcription (RT)-PCR analysis of Ghd7 (A), Ehd1 (B), Hd3a (C), and RFT1 (D). After plants were grown for 2 weeks under LD conditions, they were entrained under various daylengths for 5 d prior to sampling. The aboveground parts of the plants were collected at 3 h after dawn and used for RNA preparation. The x axis indicates daylength. The y axis indicates the expression levels relative to UBIQUITIN (UBQ), on a standard scale for A and a log scale for B to D. Bars and error bars indicate average values and sds, respectively, based on three biological repeats. Data are representative of at least three independent experiments.
Figure 3.
Figure 3.
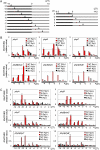
Ghd7 induction by light signals at distinct phases of the circadian clock. A, Schematic diagrams of light treatments for the expression analysis. After entrainment under SD (right) and LD (left) conditions for 14 d, plants were transferred to continuous dark conditions at dusk. Plants were then exposed to a 10-min red-light pulse, and aboveground plant parts were collected 2 h after irradiation for RNA preparation. Black, gray, and red bars represent dark condition, subjective light condition, and red-light irradiation, respectively. Black arrows show when samples were collected. B to C, Quantitative RT-PCR analysis of Ghd7 mRNA in phytochrome mutants entrained under LD (B) or SD (C) conditions. Values on the x axis of each section correspond to the treatment and sampling patterns in A. The labels A, B, C, BC, AC, and AB in the figure keys indicate phyA, phyB, phyC, phyB phyC, phyA phyC, and phyA phyB, respectively. Rp(+) and Rp(−) indicate treatments with and without red-light pulse, respectively. Bars and error bars indicate average values and sds, respectively, based on three biological repeats. Data are representative of three or more independent experiments.
Figure 4.
Figure 4.
Ehd1 induction by blue-light signals at different phases of the circadian clock. A, Schematic diagrams of light treatment for the expression analysis. After entrainment under (right) SD or (left) LD conditions for 14 d, plants were transferred to continuous dark conditions at dusk. Plants were exposed to 2 h of blue light at various timings. Aboveground plant parts were collected at the end of blue-light irradiation for RNA preparation. Black, gray, and blue bars represent dark condition, subjective light condition, and blue-light irradiation, respectively. Black arrows show when samples were collected. B to C, Quantitative RT-PCR analysis of Ehd1 mRNA in plants entrained under SD (B) or LD (C) conditions. Values on the x axis of each section correspond to the treatment/sampling patterns in A. Blue and Dark indicate treatments with and without blue-light pulse, respectively. Bars and error bars indicate average values and sds, respectively, based on three biological repeats. Data shown are representative of more than two independent experiments.
Figure 5.
Figure 5.
Overexpression of Ehd1 can promote Hd3a and RFT1 expression only under SD (10 h L, 14 h D) conditions. A, Flowering time was measured in transgenic plants overexpressing Ehd1 (Ehd1-ox). The average value and sd are based on more than five individuals. Data from a representative transgenic line are shown. B, Top section, immunoblots of transgenic plants around dawn. Overexpressing Ehd1 protein was detected using anti-FLAG antibody. Bottom section, ponceau S staining membrane is shown as loading controls. Shown data are the representative of two independent experiments. Parent cultivar (Taichung 65) was used as control. [See online article for color version of this figure.]
Figure 6.
Figure 6.
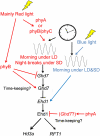
Newly proposed model of daylength measurement in rice. Red and blue lines indicate red- and blue-light-mediated responses, respectively. In addition to the two gate mechanisms, there are two phytochrome-dependent controls for time-keeping mechanisms in rice: LD-prominent promotion of Ghd7 repressor activity by phyB and LD-prominent inhibition of Ehd1 activity by phyA.

Similar articles

Cited by

References

    1. Borthwick HA. (1964) Phytochrome action and its time displays. Am Nat 98: 347–355
    1. Clack T, Shokry A, Moffet M, Liu P, Faul M, Sharrock RA. (2009) Obligate heterodimerization of Arabidopsis phytochromes C and E and interaction with the PIF3 basic helix-loop-helix transcription factor. Plant Cell 21: 786–799 - PMC - PubMed
    1. Doi K, Izawa T, Fuse T, Yamanouchi U, Kubo T, Shimatani Z, Yano M, Yoshimura A. (2004) Ehd1, a B-type response regulator in rice, confers short-day promotion of flowering and controls FT-like gene expression independently of Hd1. Genes Dev 18: 926–936 - PMC - PubMed
    1. Franklin KA, Quail PH. (2010) Phytochrome functions in Arabidopsis development. J Exp Bot 61: 11–24 - PMC - PubMed
    1. Hanumappa M, Pratt LH, Cordonnier-Pratt MM, Deitzer GF. (1999) A photoperiod-insensitive barley line contains a light-labile phytochrome B. Plant Physiol 119: 1033–1040 - PMC - PubMed

Publication types

LinkOut - more resources