. 2011 Oct;121(10):3860-71.
doi: 10.1172/JCI45963. Epub 2011 Sep 1.

T cell killing by tolerogenic dendritic cells protects mice from allergy

Affiliations

T cell killing by tolerogenic dendritic cells protects mice from allergy

Ulrike Luckey et al. J Clin Invest. 2011 Oct.

Abstract

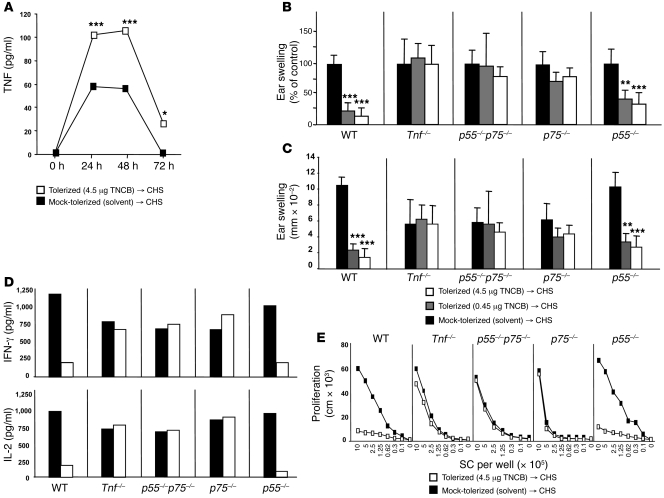
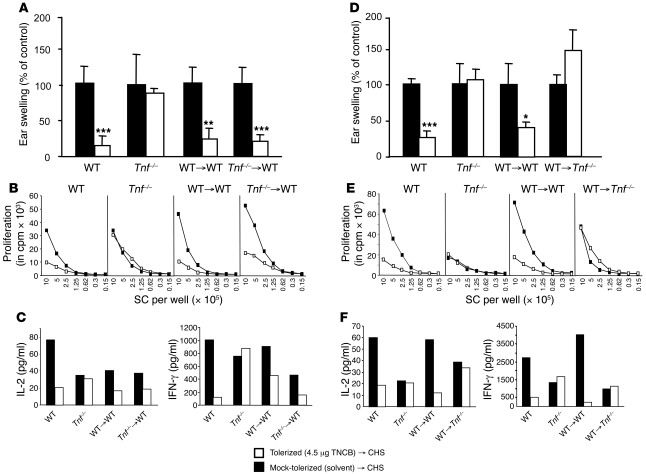
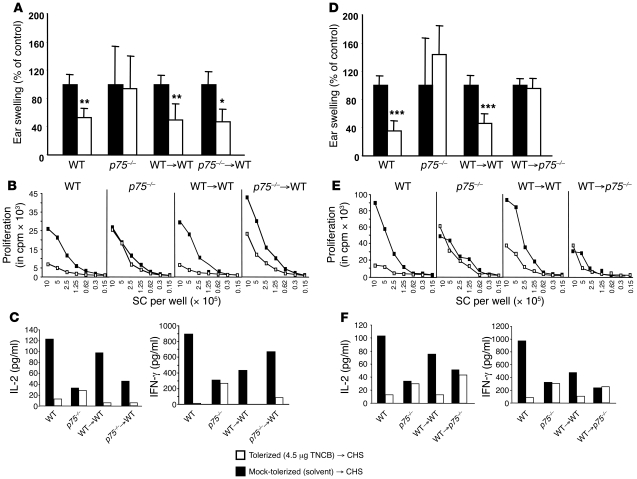
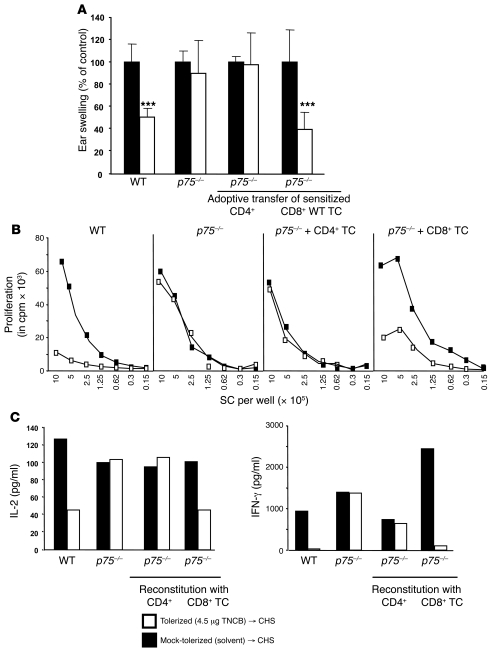
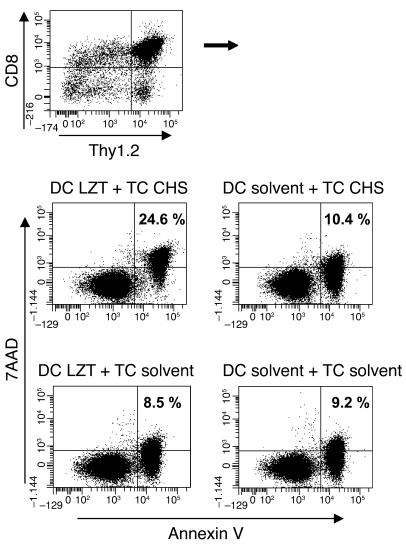
It is well established that allergy development can be prevented by repeated low-dose exposure to contact allergens. Exactly which immune mechanisms are responsible for this so-called low zone tolerance (LZT) is not clear, although CD8⁺ suppressor T cells are known to have a role. Here, we show that TNF released by tolerogenic CD11⁺CD8⁺ DCs located in skin-draining lymph nodes is required and sufficient for development of tolerance to contact allergens in mice. DC-derived TNF protected mice from contact allergy by inducing apoptosis in allergen-specific effector CD8⁺ T cells via TNF receptor 2 but did not contribute to the generation and function of the regulatory T cells associated with LZT. The TNF-mediated killing mechanism was induced in an allergen-specific manner. Activation of tolerogenic DCs by LZT CD8⁺ suppressor T cells and enhanced TNF receptor 2 expression on contact allergen-specific CD8⁺ effector T cells were required for LZT. Our findings may explain how tolerance protects from allergic diseases, which could allow for the development of new strategies for allergy prevention.


Figures

Figure 1
Figure 1. TNF and p75 are required for LZT.
(A) Release of TNF 24, 48, and 72 hours after hapten-specific restimulation of lymph node cells obtained from tolerized (TNCB 4.5 μg), sensitized, and challenged mice versus mock-tolerized (solvent), sensitized, and challenged mice (n = 6 per group per experiment, data shown are pooled from 5 experiments). (BE) Efficacy of LZT as quantified by assessing CHS-induced ear swelling and CD8+ T cell cytokine pattern and proliferation after restimulation. Data represent CHS-induced relative (B) and absolute (C) changes in ear thickness, (D) IFN-γ and IL-2 production of CD8+ T cells (detected by ELISA), and (E) T cell proliferation (in cpm, incorporation of [3H]thymidine) after hapten-specific restimulation in vitro. BE show 1 of 3 independent experiments (5–6 mice per group), which all yielded similar results. Data are shown as mean ± SD. *P < 0.05; **P < 0.01; ***P < 0.001.
Figure 2
Figure 2. TNF is critical during the effector phase of LZT.
Efficacy of LZT as assessed by measuring inhibition of CHS responses (A and D), T cell proliferation (B and E), and cytokine patterns (C and F) after restimulation using WT mice, Tnf–/–, and WT mice injected with lymph node–derived CD8+ T cells from tolerized (white bars and white symbols) or mock-tolerized (solvent-treated; black bars and black symbols) WT mice (WT→WT) or from Tnf–/– mice (Tnf–/–→WT), and Tnf–/– mice injected with lymph node–derived CD8+ T cells from tolerized or mock-tolerized (solvent-treated) WT mice (WT→Tnf–/–) that were subsequently subjected to sensitization and challenge with TNCB (CHS). 1 of 3 independent experiments with similar results is shown (5–6 mice per group and per experiment). Data are shown as mean ± SD. *P < 0.05; **P < 0.01; ***P < 0.001.
Figure 3
Figure 3. p75-mediated signaling is mandatory during the effector phase of LZT.
Efficacy of LZT as assessed by measuring inhibition of CHS responses (A and D), T cell proliferation (B and E), and cytokine patterns (C and F) after restimulation using tolerized (white bars and white symbols) or mock-tolerized (solvent-treated; black bars and black symbols) WT mice or p75-deficient mice (p75–/–), WT mice injected with lymph node–derived CD8+ T cells from tolerized or solvent-treated WT mice (WT→WT) or from p75–/– mice (p75–/–→WT), and p75–/– mice injected with lymph node–derived CD8+ T cells from tolerized or solvent-treated WT mice (WT→p75–/–) that were subsequently subjected to sensitization and challenge with TNCB to induce CHS. 1 of 3 independent experiments with similar results is shown (5–6 mice per group and per experiment). Data are shown as mean ± SD. *P < 0.05; **P < 0.01; ***P < 0.001.
Figure 4
Figure 4. p75-expressing CD8+ effector T cells of CHS are targets of TNF during LZT.
LZT responses measured by assessing CHS responses (A), T cell proliferation (B), and cytokine release following restimulation (C) after challenge in tolerized (white bars) or mock-tolerized (solvent-treated; black bars) WT mice and p75–/– mice that were then sensitized and challenged, and in tolerized or solvent-treated p75–/– mice transferred with CD4+ or CD8+ T cells obtained from sensitized WT mice and subsequently challenged. 1 of 3 independent experiments with similar results is shown (5–6 mice per group and per experiment). Data are shown as mean ± SD. ***P < 0.001.
Figure 5
Figure 5. CHS effector CD8+ T cells exhibit enhanced expression of p75, which increases their susceptibility to TNF-mediated apoptosis in LZT.
(A) Percentage of p75+CD8+ T cells in sensitized (black bar) and solvent-treated (gray bar) mice as assessed by flow cytometry (pooled data of 6 independent experiments). (B) Percentage of p75+CD8+ T cells in tolerized (white bars) and mock-tolerized (solvent-treated; black bars) Thy1.1+ recipient mice (5 per group) that were adoptively transferred with T cells isolated from sensitized Thy1.2+ mice and then challenged to induce CHS. Gates were set on recipients’ Thy1.1+ cells or Thy1.2+ T cells (derived from the sensitized donor mice). Pooled data from 4 independent experiments (left panel) and data from 1 representative experiment (right panel) are shown. Data are shown as mean ± SD. *P < 0.05; **P < 0.01.
Figure 6
Figure 6. LZT is associated with increased TNF/p75-induced apoptosis in CHS effector CD8+ T cells.
(AD) Apoptosis in lymph node cells obtained 24 hours after challenge from tolerized and sensitized Tnf–/– and corresponding WT mice (A and B) and from p75–/– and corresponding WT mice (C and D). CD8+ T cell apoptosis was detected by flow cytometry (annexin V staining, pooled cells obtained from 5–6 animals). 1 of 4 experiments with similar results (A and C) and pooled data of 4 experiments (B and D) are shown. (E and F) Percentages of apoptotic Thy1.2+ CD8+ T cells as assessed by flow cytometry (annexin V+/CD8+) in lymph node cells obtained after challenge with TNCB from TNCB-tolerized or mock-tolerized Thy1.1+ mice that were then reconstituted with T cells isolated from TNCB-sensitized Thy1.2+ mice (E) or in lymph node cells obtained after challenge with DNFB from TNCB-tolerized or mock-tolerized Thy1.1+ mice that had been reconstituted with T cells isolated from DNFB-sensitized Thy1.2+ mice (F). For analyses, gate was set on Thy1.2+ T cells (derived from the sensitized donor mice). 1 of 3 independent experiments with similar results is shown. 5 per group per experiment were used. Data are shown as mean ± SD. *P < 0.05; **P < 0.01.
Figure 7
Figure 7. CD8+ DCs are the critical source for TNF in LZT.
(A) LZT assessed by measuring CHS responses after challenge in tolerized (white bars) or mock-tolerized (solvent-treated; black bars) WT mice and Tnf–/– mice that were then sensitized, and in tolerized or solvent-treated WT mice or Tnf–/– mice that were first injected with CD4+ or CD8+ lymph node cells from naive WT mice and then sensitized. 1 of 3 independent experiments with similar results is shown (5–6 mice per group and per experiment). (B) Percentage of TNF-positive CD8+ T cells and TNF-positive CD8+CD11c+ DCs obtained from tolerized, sensitized, and challenged WT mice as assessed by flow cytometry (staining for intracellular TNF) before and after restimulation with TNBS in vitro 24 hours after challenge (during the effector phase of LZT). Pooled data of 3 to 5 independent experiments with similar results (5 mice per group per experiment) (upper panel) and from 1 representative experiment (lower panels) are shown. (C) Percentage of TNF-positive CD8+CD11c+ DCs obtained before challenge (during the LZT induction phase) or after challenge (during the LZT effector phase) from tolerized mice that had been sensitized and challenged or mock-tolerized (solvent-treated) animals. Cells were analyzed by intracellular FACS staining for TNF before or after restimulation with TNBS. Pooled data of 3 to 5 independent experiments with similar results (5 mice per group per experiment) are demonstrated. Data are shown as mean ± SD. *P < 0.05; **P < 0.01.
Figure 8
Figure 8. CD8+CD11c+ DC–derived TNF is essential for LZT.
LZT responses measured by assessing inhibition of CHS-associated ear swelling (A, C, E, and G) and T cell proliferation (B, D, F, and H) in tolerized and sensitized (white bars and white symbols) or mock-tolerized and sensitized (solvent-treated; black bars and symbols) WT mice and Tnf–/– mice, in Tnf–/– mice that were first adoptively transferred with highly purified (>99.9%) CD8+CD11c T cells or CD8+CD11c+ DCs isolated from naive WT mice and then sensitized (A and B), in Tnf–/– mice that were first adoptively transferred with highly purified CD8+CD11c+ DCs isolated from naive Tnf–/– or WT mice and then sensitized (C and D), in Tnf–/– mice that were first adoptively transferred with highly purified CD8-negative CD11c+ DCs isolated from naive WT animals and then sensitized (E and F), or in Tnf–/– mice that were first adoptively transferred with highly purified CD8+CD11c+ DCs isolated from naive memTnf–/– mice and then sensitized (G and H). 1 of 2 independent experiments with similar results is shown (5–6 mice per group and per experiment). Data are shown as mean ± SD. *P < 0.05; **P < 0.01; ***P < 0.001.
Figure 9
Figure 9. CD8+CD11c+ DCs induce apoptosis in CD8+ CHS effector T cells.
Percentage of apoptosis (annexin V+/7-AAD+) in CD8+ CHS effector T cells (TC CHS, obtained from sensitized and challenged Thy1.2+ mice, middle panel) and CD8+ T cells from mock-sensitized and -challenged Thy1.2+ mice (TC control, lower panel) cocultured at a ratio of 10:1 with CD8+CD11c+ DCs obtained from tolerized Thy1.1+ mice (DC LZT) or mock-tolerized (solvent-treated) Thy1.1+ mice (DC control). Gate was set on CD8+Thy1.2+ T cells (upper panel). Representative results from 3 independent experiments with 3 mice (for T cell isolation) and 12 mice (for DC isolation) per group and per experiment are shown.

Comment in

  • Allergy: Peaceful death ends pain.
    Bordon Y. Bordon Y. Nat Rev Immunol. 2011 Sep 23;11(10):643. doi: 10.1038/nri3076. Nat Rev Immunol. 2011. PMID: 21941293 No abstract available.

Similar articles

Cited by

References

    1. Cavani A, De Pita O, Girolomoni G. New aspects of the molecular basis of contact allergy. Curr Opin Allergy Clin Immunol. 2007;7(5):404–408. doi: 10.1097/ACI.0b013e3282ef6923. - DOI - PubMed
    1. Steinbrink K, Sorg C, Macher E. Low zone tolerance to contact allergens in mice: a functional role for CD8+ T helper type 2 cells. J Exp Med. 1996;183(3):759–768. doi: 10.1084/jem.183.3.759. - DOI - PMC - PubMed
    1. Steinbrink K, Kolde G, Sorg C, Macher E. Induction of low zone tolerance to contact allergens in mice does not require functional Langerhans cells. J Invest Dermatol. 1996;107(2):243–247. doi: 10.1111/1523-1747.ep12329721. - DOI - PubMed
    1. Seidel-Guyenot W, Alt R, Perschon S, Knop J, Steinbrink K. B cells are not required for T cell priming in low zone tolerance to contact allergens and contact hypersensitivity. Eur J Immunol. 2004;34(11):3082–3090. doi: 10.1002/eji.200425402. - DOI - PubMed
    1. Maurer M, Seidel-Guyenot W, Metz M, Knop J, Steinbrink K. Critical role of IL-10 in the induction of low zone tolerance to contact allergens. J Clin Invest. 2003;112(3):432–439. - PMC - PubMed

Publication types

MeSH terms

Substances