. 2011 Sep 1;2(9):e200.
doi: 10.1038/cddis.2011.80.

Distribution of CD133 reveals glioma stem cells self-renew through symmetric and asymmetric cell divisions

Affiliations

Distribution of CD133 reveals glioma stem cells self-renew through symmetric and asymmetric cell divisions

J D Lathia et al. Cell Death Dis. .

Abstract

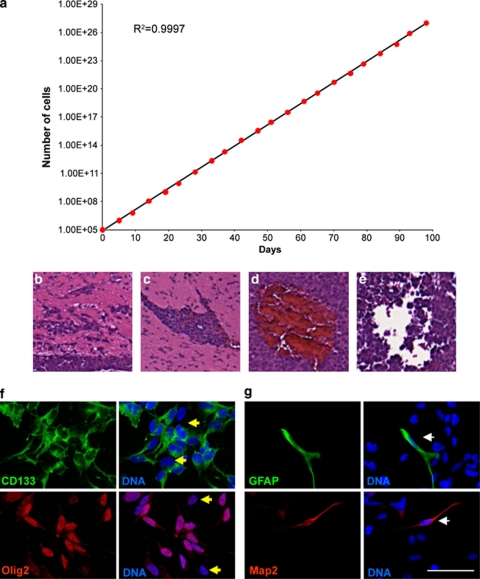
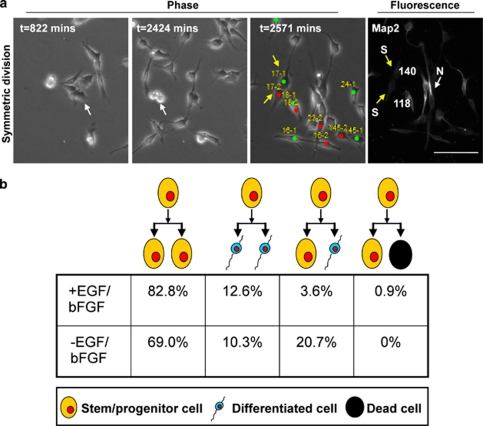
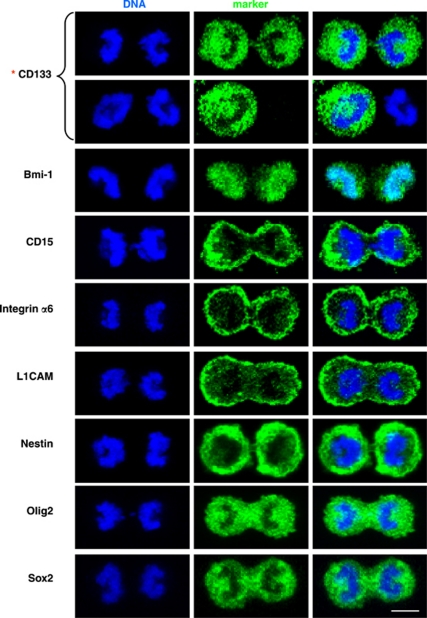
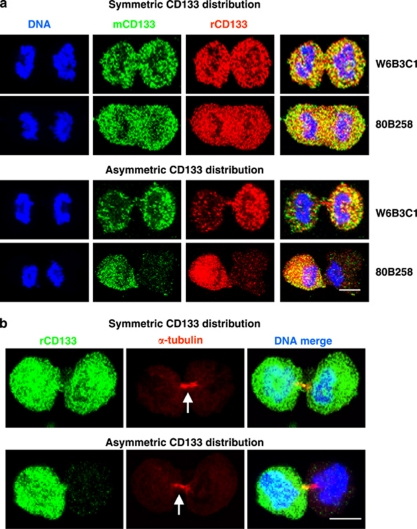
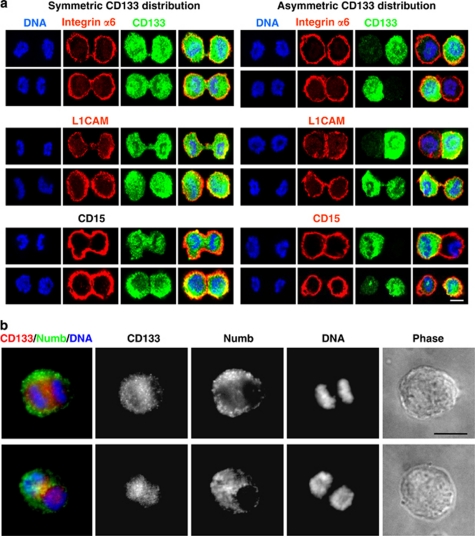
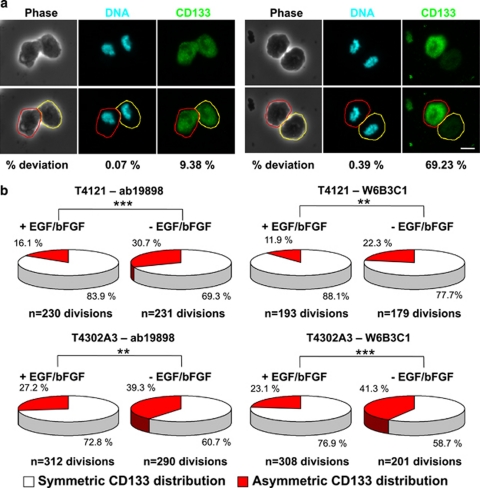
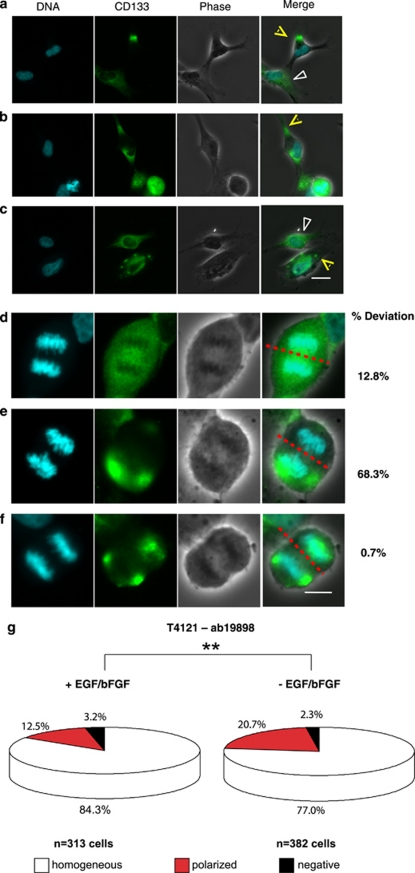
Malignant gliomas contain a population of self-renewing tumorigenic stem-like cells; however, it remains unclear how these glioma stem cells (GSCs) self-renew or generate cellular diversity at the single-cell level. Asymmetric cell division is a proposed mechanism to maintain cancer stem cells, yet the modes of cell division that GSCs utilize remain undetermined. Here, we used single-cell analyses to evaluate the cell division behavior of GSCs. Lineage-tracing analysis revealed that the majority of GSCs were generated through expansive symmetric cell division and not through asymmetric cell division. The majority of differentiated progeny was generated through symmetric pro-commitment divisions under expansion conditions and in the absence of growth factors, occurred mainly through asymmetric cell divisions. Mitotic pair analysis detected asymmetric CD133 segregation and not any other GSC marker in a fraction of mitoses, some of which were associated with Numb asymmetry. Under growth factor withdrawal conditions, the proportion of asymmetric CD133 divisions increased, congruent with the increase in asymmetric cell divisions observed in the lineage-tracing studies. Using single-cell-based observation, we provide definitive evidence that GSCs are capable of different modes of cell division and that the generation of cellular diversity occurs mainly through symmetric cell division, not through asymmetric cell division.


Figures

Figure 1
Figure 1
Clonal GSCs can be expanded in culture and contain heterogeneity. (a) Population doublings of T4302 A3 clonal cells demonstrated exponential growth over time starting from 100 000 initial cells. (be) Representative histology for an intracranial tumor generated from 5000 clonal T4302 A3 cells is shown. Tumors (n=4/4) formed with clone T4302 A3. Additional clones assayed had identical outcomes (data not shown). Intracranial tumors had typical properties of GBM; poorly defined tumor margins (b), infiltrating cells (c), aberrant vasculature (d), and regions of necrosis (e). (f) Immunofluorescence micrographs of T4302 A3 GSCs demonstrated that culturing under defined adherent expansion conditions maintained heterogeneous GSC marker expression (CD133, green; Olig2, red; and marker-negative cells, yellow arrowheads). (g) Neural (Map2, red) and glial (GFAP, green) differentiation was also detected in these cultures (white arrowhead). Nuclei were counterstained with Hoechst 33342 (blue). Scale bar indicates 50 μm
Figure 2
Figure 2
Growth factor withdrawal increased asymmetric cell division in time-lapse lineage tracing. CD133-positive GSCs were enriched by FACS and were plated onto Geltrex-coated plates in the presence or absence of growth factors. Cell divisions were recorded by time-lapse video microscopy for 42 h. At the end of image capturing, cells were fixed and immunostained for differentiation markers for neural (Map2) and glial (GFAP) lineages. (a) Example phase (left) and fluorescence (right) images of tracking and immunophenotyping results for daughter cells at the end of a 42-h observation period when Map2 was used as a neural marker. Red and green circles with corresponding number represent progeny generated from the same parent cell (cell 17 shown as an example). Pixel intensity values normalized to background levels are displayed for each cell in the fluorescence micrographs. The scale bar indicates 50 μm. (b) Analysis of time-lapse video microscopy detected four types of cell divisions. Single-cell lineage-tracing time-lapse microscopy movies demonstrated that growth factor withdrawal (n=111 cell divisions for EGF and basic FGF conditions, n=29 cell divisions for growth factor withdrawal conditions) decreased the number of symmetric stem/progenitor cell divisions and increased the generation of differentiated progeny and cell death. Proportional comparison of cell division types between conditions indicated a statistically significant difference, P<0.05, using Fisher's exact test. (N, neural marker positive cell (white arrow); S, stem/progenitor cell (yellow arrow))
Figure 3
Figure 3
A screen of stem/progenitor markers on mitotic cell pairs reveals that CD133 is unequally distributed in a fraction of GSCs. Confocal micrographs of mitotic cell pairs derived from T4302 clone A3 cell populations grown in expansion conditions stained for the indicated markers of stem/progenitor cells (green). Symmetric distribution between nascent daughter cells was observed for Bmi1, CD15, integrin-α6, L1CAM, Nestin, Olig2, and Sox2. In contrast, CD133 exhibited both symmetric and asymmetric distributions between progenies (asterisk). Nuclei were counterstained with Hoechst 33342 (blue). Scale bar indicates 5 μm
Figure 4
Figure 4
Equal and unequal distribution of CD133 is observed using various anti-CD133 antibodies. (a) Confocal micrographs of T4302 clone A3 cells revealed that symmetric and asymmetric distributions of CD133 were detected with multiple CD133 antibodies. W6B3C1 or 80B258 mouse monoclonal antibody (green, mCD133) was used together with ab19898 rabbit polyclonal antibody (red, rCD133). (b) Confocal micrographs of double staining of CD133 (ab19898, green, rCD133) with α-tubulin (red) confirmed that mitotic pairs of T4302 A3 clonal cells were undergoing cell division. Arrows indicate the mid-body. Similar data were observed with non-clonal T4121 cells (data not shown). Nuclei were visualized with Hoechst 33342. Scale bar indicates 5 μm
Figure 5
Figure 5
Equal and unequal distribution of CD133 irrespective of other GSC markers, but Numb. (a) Confocal micrographs of mitotic cell pairs derived from T4302 A3 clonal cells grown in expansion conditions demonstrated constant uniform expression patterns for integrin-α6, L1CAM, and CD15 (red). In contrast, symmetric or asymmetric CD133 distribution was detected using ab19898 rabbit antiserum (green). Identical results were obtained with non-clonal T4121 cells (data not shown). (b) Fluorescent micrographs of mitotic cell pairs derived from T4302 A3 clonal cell populations grown in expansion conditions demonstrated consistent asymmetric distribution of CD133 and Numb. Nuclei were counterstained with Hoechst 33342 (blue). Scale bars indicate 5 μm for a and 15 μm for b
Figure 6
Figure 6
CD133 asymmetry increased upon growth factor deprivation. (a) Representative phase and fluorescence micrographs of GSCs analyzed during mitosis stained with rabbit antiserum ab19898 against CD133 (green). Similar images were produced with mouse monoclonal antibody W6B3C1 against CD133 (images not shown). Cells were counterstained with Hoechst 33342 (blue) to mark DNA. Analysis occurred by comparing pixel intensities of DNA with CD133 staining in the area containing each emerging daughter cell, as indicated by the red and yellow lines. Examples of symmetrical and asymmetrical distributions of CD133 are shown. Percent deviation in staining between daughter cells is displayed below micrographs. The scale bar indicates 10 μm. (b) Quantification of images as illustrated in a demonstrated that withdrawal of EGF and basic FGF (bFGF) increased the fraction of mitotic pairs with asymmetric CD133 distribution when compared with cultures with EGF and bFGF in both T4121 and T4302 cells. N, number of cell divisions. **P<0.01; ***P<0.001 as assessed using Pearson's χ2-test
Figure 7
Figure 7
Polarization of CD133 during interphase and mitosis. Actively proliferating glioma cells on Geltrex-coated coverslips were fixed and stained for CD133 using rabbit antiserum ab19898 (green). Nuclei were counterstained with Hoechst 33342 (blue). (ac) Polarized localization of CD133 was detected in a fraction of interphase cells, as indicated by yellow arrows. However, many cells contained diffuse CD133 staining, as indicated by white arrows. (df) Polarized localization of CD133 was also sometimes detected during mitosis. (d) Each daughter cell would receive similar total amounts of CD133 when CD133 was evenly distributed throughout the dividing cells. (e) When CD133 is polarized during division, daughter cells could receive divergent amounts of CD133 if expressions were asymmetrically distributed. (f) Even when CD133 is polarized during mitosis, daughter cells could receive similar amounts of CD133 if expressions were equally distributed. The scale bars indicate 20 μm for ac and 10 μm for df. (g) The frequency of interphase cells with polarized CD133 distribution increased when growth factors were deprived from culture media. N, number of cells analyzed. **P<0.02 (P=0.0146) by Pearson's χ2 analysis

References

    1. Stupp R, Hegi ME, Mason WP, van den Bent MJ, Taphoorn MJ, Janzer RC, et al. Effects of radiotherapy with concomitant and adjuvant temozolomide versus radiotherapy alone on survival in glioblastoma in a randomised phase III study: 5-year analysis of the EORTC-NCIC trial. Lancet Oncol. 2009;10:459–466. - PubMed
    1. Anderson K, Lutz C, van Delft FW, Bateman CM, Guo Y, Colman SM, et al. Genetic variegation of clonal architecture and propagating cells in leukaemia. Nature. 2011;469:356–361. - PubMed
    1. Singh SK, Clarke ID, Terasaki M, Bonn VE, Hawkins C, Squire J, et al. Identification of a cancer stem cell in human brain tumors. Cancer Res. 2003;63:5821–5828. - PubMed
    1. Singh SK, Hawkins C, Clarke ID, Squire JA, Bayani J, Hide T, et al. Identification of human brain tumour initiating cells. Nature. 2004;432:396–401. - PubMed
    1. Ignatova TN, Kukekov VG, Laywell ED, Suslov ON, Vrionis FD, Steindler DA. Human cortical glial tumors contain neural stem-like cells expressing astroglial and neuronal markers in vitro. Glia. 2002;39:193–206. - PubMed

Publication types