. 2011 Oct 11;50(40):8540-7.
doi: 10.1021/bi200710m. Epub 2011 Sep 15.

Effects of a protecting osmolyte on the ion atmosphere surrounding DNA duplexes

Affiliations

Effects of a protecting osmolyte on the ion atmosphere surrounding DNA duplexes

Joshua M Blose et al. Biochemistry. .

Abstract

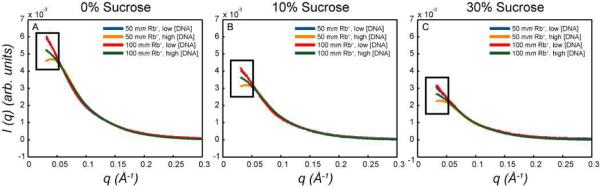
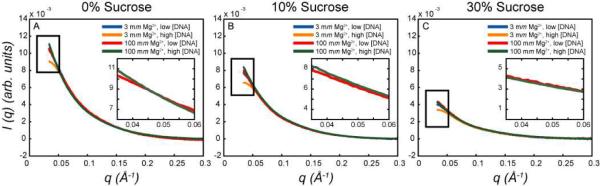
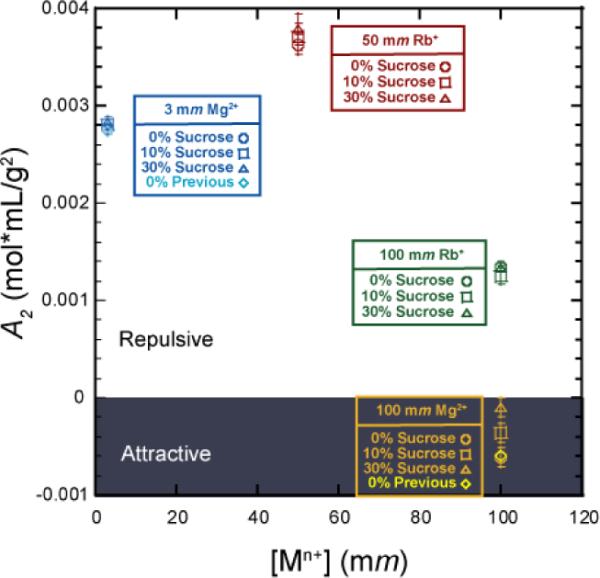
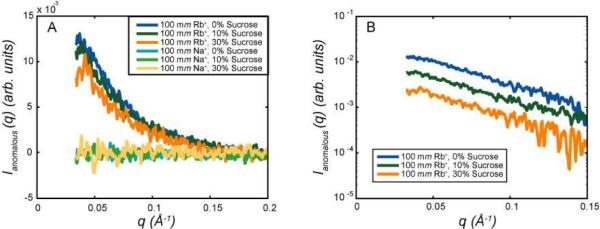
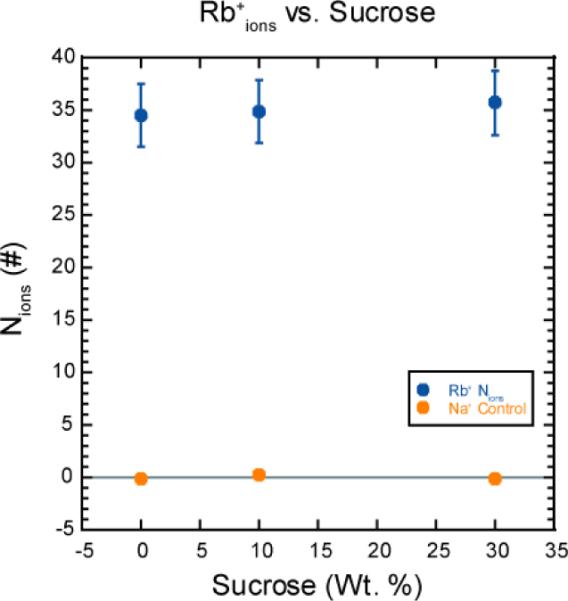
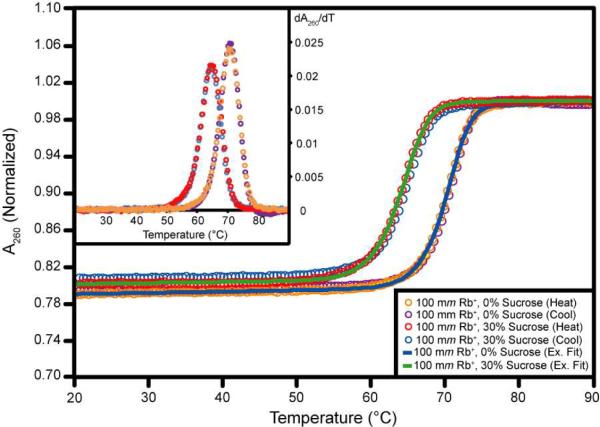
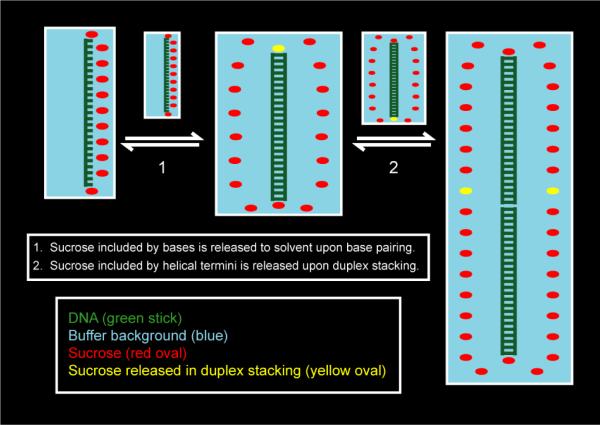
Osmolytes are small, chemically diverse, organic solutes that function as an essential component of cellular stress response. Protecting osmolytes enhance protein stability via preferential exclusion, and nonprotecting osmolytes, such as urea, destabilize protein structures. Although much is known about osmolyte effects on proteins, less is understood about osmolyte effects on nucleic acids and their counterion atmospheres. Nonprotecting osmolytes destabilize nucleic acid structures, but effects of protecting osmolytes depend on numerous factors including the type of nucleic acid and the complexity of the functional fold. To begin quantifying protecting osmolyte effects on nucleic acid interactions, we used small-angle X-ray scattering (SAXS) techniques to monitor DNA duplexes in the presence of sucrose. This protecting osmolyte is a commonly used contrast matching agent in SAXS studies of protein-nucleic acid complexes; thus, it is important to characterize interaction changes induced by sucrose. Measurements of interactions between duplexes showed no dependence on the presence of up to 30% sucrose, except under high Mg(2+) conditions where stacking interactions were disfavored. The number of excess ions associated with DNA duplexes, reported by anomalous small-angle X-ray scattering (ASAXS) experiments, was sucrose independent. Although protecting osmolytes can destabilize secondary structures, our results suggest that ion atmospheres of individual duplexes remain unperturbed by sucrose.


Figures

Figure 1
Figure 1. Concentration Normalized Scattering Intensity Profiles of 25 bp Duplex DNA in Rb+ acetate and Sucrose
Panels A–C show I(q) vs. q for low and high DNA concentrations at 50 mm and 100 mm Rb+ acetate with 0%, 10%, and 30% sucrose, respectively All curves shown are the average of 16–32 scattering images, with a standard deviation of approximately 1%. The overall decrease in signal from panel A to panel C is due to contrast variation effects of the sucrose. However, the same trends in the data are observed. The curves from the 50 mm Rb+ samples fall below those from the 100 mm Rb+ samples in the low q region consistent with greater repulsion in lower ionic strength. In addition, more repulsion is observed at higher DNA concentration, signaled by a more pronounced downturn in the intensity profile at low q.
Figure 2
Figure 2. Concentration Normalized Scattering Intensity Profiles of 25 bp Duplex DNA in MgCl2 and Sucrose
Panels A–C show I(q) vs. q for low and high DNA concentrations at 3 mm and 100 mm MgCl2 with 0%, 10%, and 30% sucrose, respectively. All curves shown are the average of 16–32 scattering images, with a standard deviation of approximately 1%. The overall decrease in signal from panel A to panel C is due to contrast matching effects of the sucrose. Note that the same trends in the 3 mm Mg2+ data are observed. The curves from the 3 mm Mg2+ samples generally fall below those from the 100 mm Mg2+ samples in the low q region consistent repulsion in 3 mm Mg2+, and more repulsion is observed for the high DNA concentration samples in 3 mm Mg2+ signaled by the downturn in the intensity profile at low q compared to the low concentration profiles. However, there is a difference in the 100 mm Mg2+ samples with increasing sucrose. In no sucrose (A) the high concentration profile (green) falls above the low (red) concentration profile consistent with end-to-end stacking of the DNA duplexes. This difference is qualitatively less with increasing sucrose (B and C), suggesting less end-to-end stacking in sucrose. The insets are zoomed to 0.035 < q < 0.06 to better show the change in trend at 100 mm Mg2+ with increasing sucrose. .
Figure 3
Figure 3. A2 vs. Monovalent or Divalent Cation Concentration
Shows A2 for 50 mm and 100 mm Rb+ as well as 3 mm and 100 mm Mg2+. For all of the repulsive conditions (A2 > 0) the interaction potential among DNA duplexes remains unchanged within error with sucrose, and 0% sucrose data agrees with previously published values for the 3 mm Mg2+ data. The A2 value for 100 mm Mg2+ at 0% sucrose also agrees with previously published values, but the interaction potential decreases with increasing sucrose, suggesting disruption of end-to-end duplex stacking. Error bars shown are propagated from linear fits from Equations 2 or 3.
Figure 4
Figure 4. Concentration Normalized ASAXS profiles for 100 mm Rb+ acetate samples and 100 mm Na+ acetate controls
A) Shows ASAXS data for 0, 10, and 30% sucrose for Rb+ and Na+ controls The small differences in intensity may be from contrast matching effects of sucrose, and Na+ controls show near zero anomalous scattering intensity. B) Shows the Rb+ anomalous scattering intensity as in Panel A, but on a logarithmic scale (data offset by a multiplicative factor) to highlight the similarities in the shape of the curve decay with increasing sucrose. This shape similarity suggests the distribution of ions around the duplex is not changed by increasing sucrose concentration.
Figure 5
Figure 5. Nions vs. Sucrose
Shows Nions for Rb+ and Na+ controls at 0%, 10%, and 30% sucrose. Note that Nions is unchanged within error with increasing sucrose and agrees with previous results in 0% sucrose. Controls are also unchanging with sucrose, and near zero since no resonant elements are present in the ASAXS measurement. Error bars shown are approximately 10% for both Rb+ and Na+ with the latter being small than the size of the data points.
Figure 6
Figure 6. Absorbance vs. Temperature Curves from Thermal Denaturations
Shows representative heating and cooling melt curves for 100 mm Rb+ data in 0% (orange, purple) and 30% (red, blue) sucrose. Curves have been corrected for buffer absorbance before fitting, and example fits from Meltwin 3.5 are also shown for the heating curves. Fits of cooling data are similar, but omitted here for figure clarity. The inset shows the derivative of the melting curves with temperature. These data were smoothed using an 11-pt window.
Figure 7
Figure 7. Sucrose Influence on Folding and End-to-End Stacking in 25 bp DNA Duplexes
Shown above in step one, sucrose accumulated by DNA bases in the single stranded state is released upon duplex formation. In step two, end-to-end stacking cause the release of sucrose included at the helix ends. With increasing sucrose this step is more unfavorable and less stacking is observed.

Similar articles

Cited by

References

    1. Yancey PH, Clark ME, Hand SC, Bowlus RD, Somero GN. Living with water stress: evolution of osmolyte systems. Science. 1982;217:1214–1222. - PubMed
    1. Bolen DW. Protein stabilization by naturally occurring osmolytes. Methods Mol Biol. 2001;168:17–36. - PubMed
    1. Yancey PH. Organic osmolytes as compatible, metabolic and counteracting cytoprotectants in high osmolarity and other stresses. J Exp Biol. 2005;208:2819–2830. - PubMed
    1. Burg MB, Ferraris JD. Intracellular organic osmolytes: function and regulation. J Biol Chem. 2008;283:7309–7313. - PMC - PubMed
    1. Timasheff SN. The control of protein stability and association by weak interactions with water: how do solvents affect these processes? Annu Rev Biophys Biomol Struct. 1993;22:67–97. - PubMed

Publication types

MeSH terms