Review
. 2012 Jun 1;16(11):1264-84.
doi: 10.1089/ars.2011.4243. Epub 2011 Nov 17.

Warburg meets autophagy: cancer-associated fibroblasts accelerate tumor growth and metastasis via oxidative stress, mitophagy, and aerobic glycolysis

Affiliations
Review

Warburg meets autophagy: cancer-associated fibroblasts accelerate tumor growth and metastasis via oxidative stress, mitophagy, and aerobic glycolysis

Stephanos Pavlides et al. Antioxid Redox Signal. .

Abstract

Significance: Here, we review certain recent advances in oxidative stress and tumor metabolism, which are related to understanding the contributions of the microenvironment in promoting tumor growth and metastasis. In the early 1920s, Otto Warburg, a Nobel Laureate, formulated a hypothesis to explain the "fundamental basis" of cancer, based on his observations that tumors displayed a metabolic shift toward glycolysis. In 1963, Christian de Duve, another Nobel Laureate, first coined the phrase auto-phagy, derived from the Greek words "auto" and "phagy," meaning "self" and "eating."

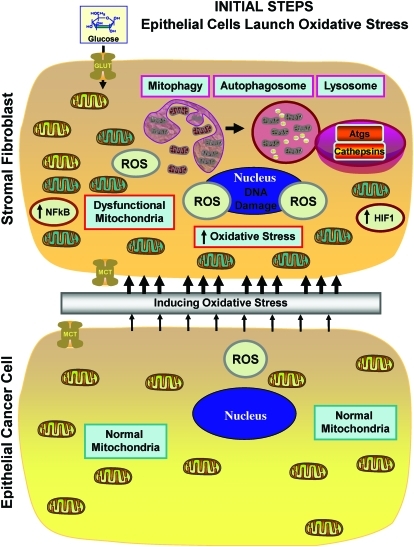
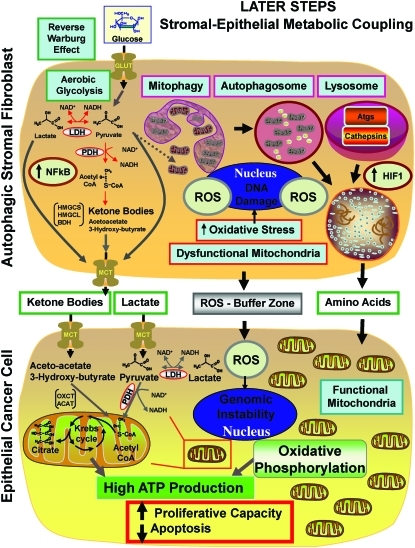
Recent advances: Now, we see that these two ideas (autophagy and aerobic glycolysis) physically converge in the tumor stroma. First, cancer cells secrete hydrogen peroxide. Then, as a consequence, oxidative stress in cancer-associated fibroblasts drives autophagy, mitophagy, and aerobic glycolysis.

Critical issues: This "parasitic" metabolic coupling converts the stroma into a "factory" for the local production of recycled and high-energy nutrients (such as L-lactate)-to fuel oxidative mitochondrial metabolism in cancer cells. We believe that Warburg and de Duve would be pleased with this new two-compartment model for understanding tumor metabolism. It adds a novel stromal twist to two very well-established cancer paradigms: aerobic glycolysis and autophagy.

Future directions: Undoubtedly, these new metabolic models will foster the development of novel biomarkers, and corresponding therapies, to achieve the goal of personalized cancer medicine. Given the central role that oxidative stress plays in this process, new powerful antioxidants should be developed in the fight against cancer.


Figures

FIG. 1.
FIG. 1.
Stromal cancer-associated fibroblasts (CAFs) promote the growth of adjacent mammary epithelial cells, via the paracrine secretion of recycled nutrients. Here, we propose that loss of stromal caveolin-1 (Cav-1) expression is a hallmark of an aggressive mammary stromal phenotype that can be used as a biomarker to predict breast cancer recurrence and metastasis. DCIS, ductal carcinoma in situ; IDC, invasive ductal carcinoma. Modified and reproduced with permission from Witkiewicz et al. (125). (To see this illustration in color, the reader is referred to the Web version of this article at www.liebertonline.com/ars).
FIG. 2.
FIG. 2.
Stromal Cav-1 expression in human breast cancer tissue. Breast tumor samples were immunostained with antibodies directed against Cav-1 and subjected to scoring. Representative examples are shown. Stromal Cav-1 was scored for each tissue sample based on three cores taken from the sample and given a numeric score of 0, 1, or 2, depending on the degree of stromal Cav-1 staining. The median of the three numeric scores was taken to be the stromal Cav-1 score for the sample. A median score of 0 was interpreted as an absence of stromal Cav-1, and scores of 1 and 2 were interpreted as the presence of stromal Cav-1. It is important to note that loss of stromal Cav-1 staining was independent of estrogen receptor (ER), progesterone receptor (PR), and human epidermal growth factor receptor 2 (HER2) status in breast cancer cells. Modified and reproduced with permission from Witkiewicz et al. (125). (To see this illustration in color, the reader is referred to the Web version of this article at www.liebertonline.com/ars).
FIG. 3.
FIG. 3.
An absence of stromal Cav-1 expression predicts early tumor recurrence and poor clinical outcome in breast cancers. Note that stromal Cav-1 is a powerful predictive biomarker for estimating a patient's risk of recurrence and survival in all of the four most common classes of breast cancer, which are based on ER, progesterone receptor (PR), and HER2 expression. Its behavior in tamoxifen-treated versus non-tamoxifen–treated patients is also shown for comparison. An asterisk (*) denotes statistical significance. Five-year progression-free survival is indicated by an arrow. p-Values ranged from 10−9 to 10−2, depending on the patients selected for analysis. Modified and reproduced with permission from Witkiewicz et al. (125).
FIG. 4.
FIG. 4.
Prognostic value of Cav-1 as a stromal biomarker for triple-negative breast cancer. Kaplan-Meier analysis of stromal Cav-1 predicts overall survival in a second independent cohort of triple-negative (TN) breast cancer patients. Patients with high levels of stromal Cav-1 (score=2) had a good clinical outcome, with 75.5% of the patients remaining alive during the follow-up period (nearly 12 years). In contrast, the median survival for patients with absent stromal Cav-1 staining (score=0) was 25.7 months. The results of this analysis were highly statistically significant (p=2.8×10⁻⁶). Modified and reproduced with permission from Witkiewicz et al. (124). (To see this illustration in color, the reader is referred to the Web version of this article at www.liebertonline.com/ars).
FIG. 5.
FIG. 5.
Loss of Cav-1 in the tumor stroma of human breast cancer patients is associated with aging, DNA damage, inflammation, cancer metabolism, and autophagy. (A) The transcriptional profiles of Cav-1–positive (+) tumor stroma (n=4) versus Cav-1–negative (−) tumor stroma (n=7) were compared, via laser-capture microdissection. Note that Cav-1–deficient stroma shows the upregulation of aging (73 transcripts), the DNA damage response (67 transcripts), NFkB signaling (11 transcripts), the immune response (31 transcripts), hypoxia-inducible transcription factor 1 (HIF1)/hypoxia target genes (65 transcripts), glycolysis/pyruvate metabolism (15 transcripts), and autophagy (22 transcripts). In human breast cancer patients, a loss of stromal Cav-1 is associated with early tumor recurrence, lymph node metastasis, drug resistance, and overall poor survival, conferring a lethal tumor microenvironment. A schematic diagram summarizing these results is presented in panel (B). See the text for details. Modified and reproduced with permission from Witkiewicz et al. (126). (To see this illustration in color, the reader is referred to the Web version of this article at www.liebertonline.com/ars).
FIG. 6.
FIG. 6.
Epithelial tumor cells induce oxidative stress in CAFs (Step 1). Note that reactive oxygen species (ROS) production in cancer cells is transferred to adjacent fibroblasts, initiating the onset of stromal oxidative stress, autophagy, and mitophagy, due to the activation of key transcription factors, namely HIF1-alpha (aerobic glycolysis) and NFkB (inflammation). (To see this illustration in color, the reader is referred to the Web version of this article at www.liebertonline.com/ars).
FIG. 7.
FIG. 7.
The onset of stromal-epithelial metabolic coupling fuels the Warburg effect in fibroblasts and oxidative mitochondrial metabolism in cancer cells (Step 2). Note that in this model, autophagic-glycolytic fibroblasts secrete both recycled and high-energy nutrients (such as ketone bodies and L-lactate, as well as glutamine). Then, cancer cells use these nutrients to fuel oxidative mitochondrial metabolism, to generate large amounts of ATP and protect themselves against apoptosis. ROS production in fibroblasts also promotes mutagenesis and genomic instability in cancer cells, driving tumor-stroma coevolution. At the same time, the cancer cells mount an antioxidant defense, by overexpressing certain key antioxidant proteins, such as the peroxiredoxins and TIGAR. (To see this illustration in color, the reader is referred to the Web version of this article at www.liebertonline.com/ars).
FIG. 8.
FIG. 8.
BNIP3L, a marker of autophagy and mitochondrial dysfunction, is selectively increased in the stroma of human breast cancers. Paraffin-embedded sections of human breast cancer samples lacking stromal Cav-1 were immunostained with antibodies directed against BNIP3L. Slides were then counterstained with hematoxylin. Note that BNIP3L is highly expressed in the stromal compartment of human breast cancers that lack stromal Cav-1. Two representative images are shown. Original magnification, 40× and 60×, as indicated. Modified and reproduced with permission from Martinez-Outschoorn et al. (68). (To see this illustration in color, the reader is referred to the Web version of this article at www.liebertonline.com/ars).
FIG. 9.
FIG. 9.
Monocarboxylate transporter (MCT4), a marker of aerobic glycolysis and lactate production, is selectively increased in the stroma of human breast cancers. Paraffin-embedded sections of human breast cancer samples lacking stromal Cav-1 were immunostained with antibodies directed against MCT4. Note that MCT4 staining is selectively localized to the fibroblastic tumor stromal compartment of human breast cancers. Two representative images are shown. Both clearly show that MCT4 staining is absent from the tumor epithelial cells, but is present in the surrounding stroma. MCT4 staining outlines the CAFs that surround nests of epithelial cancer cells. Original magnification, 40× and 60×, as indicated. Modified and reproduced with permission from Whitaker-Menezes et al. (117). (To see this illustration in color, the reader is referred to the Web version of this article at www.liebertonline.com/ars).
FIG. 10.
FIG. 10.
Cav-1 is downregulated in fibroblasts cocultured with MCF7 cells. hTERT fibroblasts and MCF7 cells were cocultured for 5 days. Then, the cells were fixed and immunostained with antibodies directed against Cav-1 (red) and cytokeratin 8/18 (green, labeling MCF7 cells). Nuclei were counterstained with DAPI (Blue). As controls, fibroblast monocultures were fixed and stained in parallel. Representative images from confocal cross sections are shown. Note that Cav-1 is greatly downregulated in fibroblasts cocultured with MCF7 cells, as compared with fibroblast monocultures. Importantly, images were acquired using identical exposure settings. The white arrow points at the nucleus of a Cav-1–negative fibroblast (K8-18 negative). To better appreciate differences in Cav-1 expression, left part shows the red channel only. Original magnification, 40×. Modified and reproduced with permission from Martinez-Outschoorn et al. (67). (To see this illustration in color, the reader is referred to the Web version of this article at www.liebertonline.com/ars).
FIG. 11.
FIG. 11.
Breast cancer cells induce ROS production in fibroblasts, driving stromal Cav-1 downregulation: rescue with antioxidants. (A) ROS are elevated in fibroblasts cocultured with MCF7 cells. To detect ROS generation, CM-H2DCFDA staining (green) was performed on hTERT fibroblasts cocultured with MCF7 cells. Also, monocultures of hTERT fibroblasts and MCF7 cells were stained in parallel. Cells were counterstained with Hoechst nuclear stain (blue). Samples were then immediately imaged using a 488 nm excitation wavelength. As a critical control, in a parallel set of experiments, cells were preincubated with the ROS scavenger N-acetylcysteine (NAC). Note that ROS are generated mainly in cocultured fibroblasts (upper middle panel) and NAC treatment completely abrogates ROS production. Minimal amounts of ROS were detected in singly cultured cells. Importantly, images were acquired using identical exposure settings. Original magnification, 20×. (B) Treatment with the ROS scavenger NAC restores Cav-1 expression in cocultured fibroblasts. Day-5 fibroblast–MCF7 cocultures were incubated with the ROS scavenger NAC (10 mM, right panels) or with vehicle alone (left panels). Upper panels: Cocultures were fixed and immunostained with anti-Cav-1 (red) and anti-K8/18 (green, detecting tumor epithelial cells) antibodies. DAPI was used to stain nuclei (blue). Note that Cav-1 levels are decreased in fibroblasts in coculture (left upper panel) and the ROS scavenger NAC blocks the Cav-1 downregulation (right upper panel). Lower panels: In a parallel experiment, CM-H2DCFDA (green) was used to detect ROS generation. Cells were stained with Hoechst nuclear stain (blue). Importantly, images were acquired using identical exposure settings. Original magnification, 40× for upper panels, 20× for lower panels. Modified and reproduced with permission from Martinez-Outschoorn et al. (66). (To see this illustration in color, the reader is referred to the Web version of this article at www.liebertonline.com/ars).
FIG. 12.
FIG. 12.
Breast cancer cells mount an antioxidant defense when cocultured with fibroblasts. Increased expression of peroxiredoxin-1 in cocultured MCF7 cells. Day-5 cocultures of hTERT fibroblasts and MCF7 cells and the corresponding homotypic cultures were immunostained with antiperoxiredoxin-1 (red) and anti-K8/18 (green, detecting tumor epithelial cells) antibodies. DAPI was used to stain nuclei (blue). Upper panels show only the red channel to appreciate peroxiredoxin-1 staining, while the lower panels show the merged images. Note that the expression level of peroxiredoxin-1 is very low in homotypic cultures of fibroblasts and MCF7 cells. However, peroxiredoxin-1 levels are greatly increased in cocultured MCF7 cells. Importantly, images were acquired using identical exposure settings. Original magnification, 20×. Modified and reproduced with permission from Martinez-Outschoorn et al. (66). (To see this illustration in color, the reader is referred to the Web version of this article at www.liebertonline.com/ars).
FIG. 13.
FIG. 13.
Rescue of oxidative stress induced DNA damage in fibroblast–MCF7 cell cocultures with NAC and L-NAME. Treatment with NAC and L-NAME abolishes DNA double-strand breaks in coculture. Day-2 cocultures of hTERT fibroblasts and MCF7 cells were treated with 10 mM NAC or with 20 mM L-NAME or with vehicle alone (H2O) for 72 h. Then, cells were immunostained with anti-gamma-H2AX (red) antibodies. DAPI was used to stain nuclei (blue). Upper panels show only the red channel to appreciate gamma-H2AX staining, while the lower panels show nuclei staining. High levels of DNA double-strand breaks are detected in cocultured cells. Note that treatment with NAC and L-NAME abolishes DNA double-strand breaks in cocultured cells. Importantly, images were acquired using identical exposure settings. Original magnification, 40×. Modified and reproduced with permission from Martinez-Outschoorn et al. (66). (To see this illustration in color, the reader is referred to the Web version of this article at www.liebertonline.com/ars).
FIG. 14.
FIG. 14.
Induction of MCT4 in CAFs is due to oxidative stress and is prevented by antioxidants. MCF7 cells were cocultured with fibroblasts and then we observed the distribution of MCT4 (red) by fluorescence microscopy. Since MCT4 expression is controlled by HIF1 and HIF1 is also activated by pseudohypoxia (oxidative stress), we assessed the effects of antioxidants on this process. Note that treatment with NAC (10 mM), a powerful antioxidant, is sufficient to block that upregulation of MCT4 in CAFs, as predicted. Epithelial cancer cells were visualized by keratin staining (green). Modified and reproduced with permission from Whitaker-Menezes et al. (117). (To see this illustration in color, the reader is referred to the Web version of this article at www.liebertonline.com/ars).

Similar articles

Cited by

References

    1. Amatangelo MD. Bassi DE. Klein-Szanto AJP. Cukierman E. Stroma-derived three-dimensional matrices are necessary and sufficient to promote desmoplastic differentiation of normal fibroblasts. Am J Pathol. 2005;167:475–488. - PMC - PubMed
    1. American Cancer Society. Breast Cancer Facts & Figures 2009–2010. Atlanta: American Cancer Society, Inc.; 2009.
    1. Andre F. Berrada N. Desmedt C. Implication of tumor microenvironment in the resistance to chemotherapy in breast cancer patients. Curr Opin Oncol. 2010;22:547–551. - PubMed
    1. Apel A. Herr I. Schwarz H. Rodemann HP. Mayer A. Blocked autophagy sensitizes resistant carcinoma cells to radiation therapy. Cancer Res. 2008;68:1485–1494. - PubMed
    1. Baehrecke EH. Autophagy: dual roles in life and death? Nat Rev Mol Cell Biol. 2005;6:505–510. - PubMed

Publication types

LinkOut - more resources