. 2012 Apr;38(2):175-200.
doi: 10.1111/j.1365-2990.2011.01215.x.

Activation status of integrated stress response pathways in neurones and astrocytes of HIV-associated neurocognitive disorders (HAND) cortex

Affiliations

Activation status of integrated stress response pathways in neurones and astrocytes of HIV-associated neurocognitive disorders (HAND) cortex

C Akay et al. Neuropathol Appl Neurobiol. 2012 Apr.

Abstract

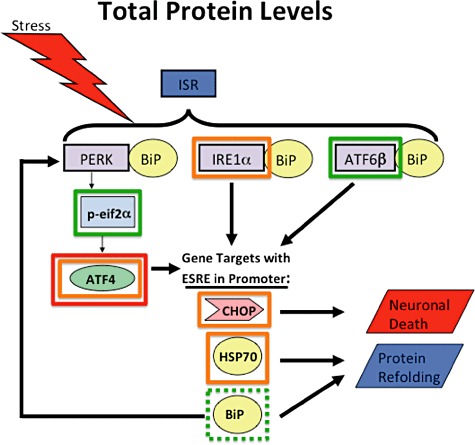
Aims: Combined anti-retroviral therapy (cART) has led to a reduction in the incidence of HIV-associated dementia (HAD), a severe motor/cognitive disorder afflicting HIV(+) patients. However, the prevalence of subtler forms of neurocognitive dysfunction, which together with HAD are termed HIV-associated neurocognitive disorders (HAND), continues to escalate in the post-cART era. The microgliosis, astrogliosis, dendritic damage, and synaptic and neuronal loss observed in autopsy cases suggest an underlying neuroinflammatory process, due to the neurotoxic factors released by HIV-infected/activated macrophages/microglia in the brain, might underlie the pathogenesis of HAND in the post-cART era. These factors are known to induce the integrated stress response (ISR) in several neurodegenerative diseases; we have previously shown that BiP, an indicator of general ISR activation, is upregulated in cortical autopsy tissue from HIV-infected patients. The ISR is composed of three pathways, each with its own initiator protein: PERK, IRE1α and ATF6.

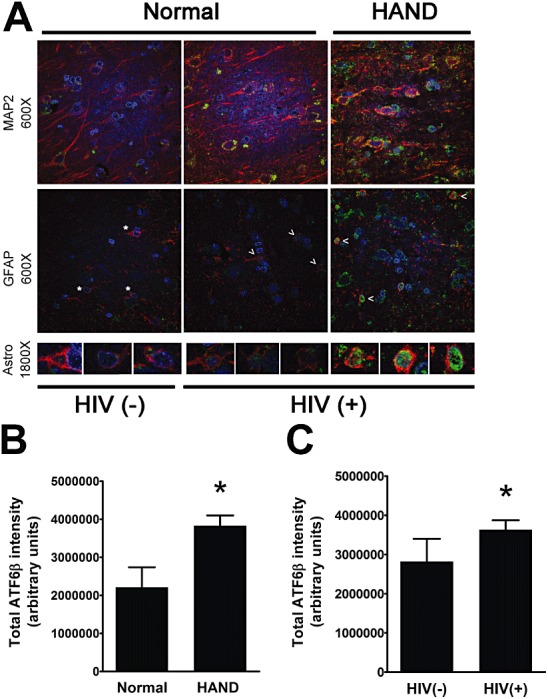
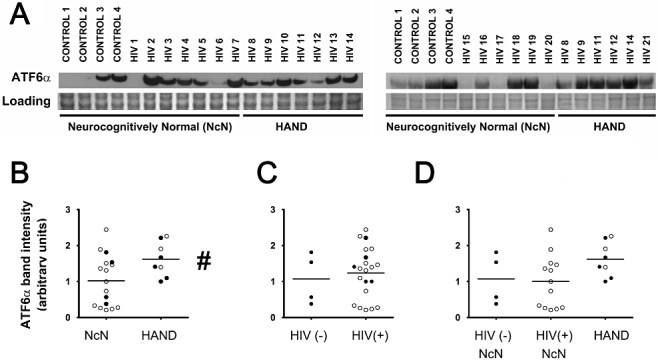
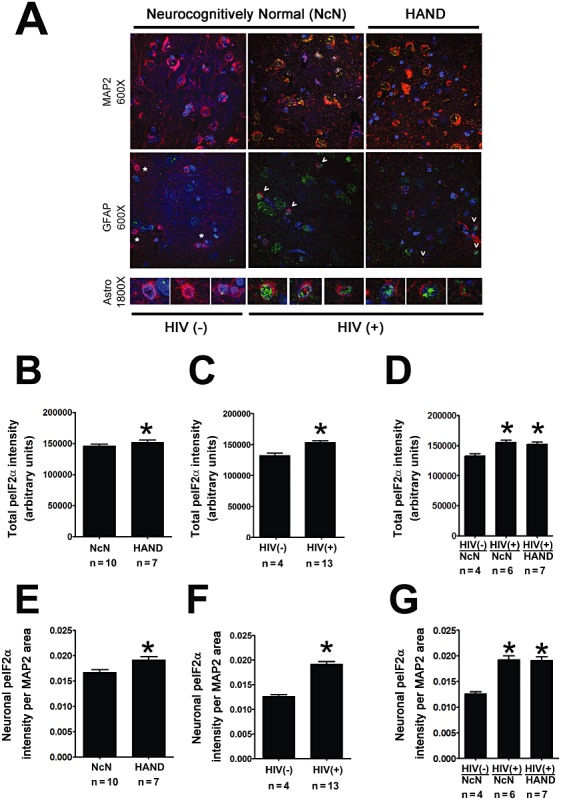
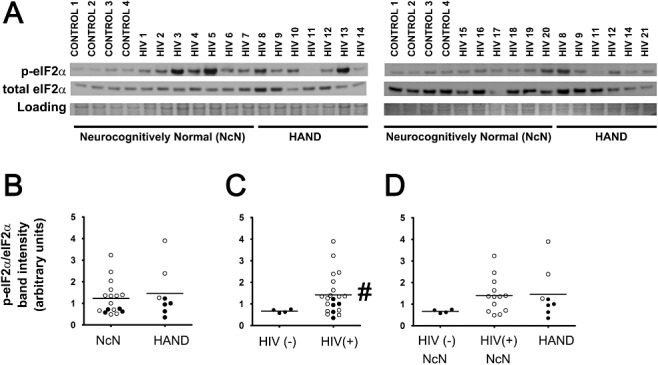
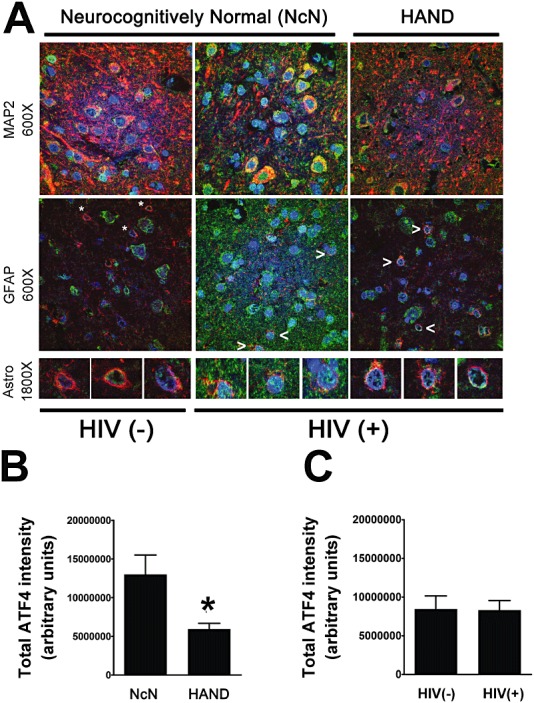
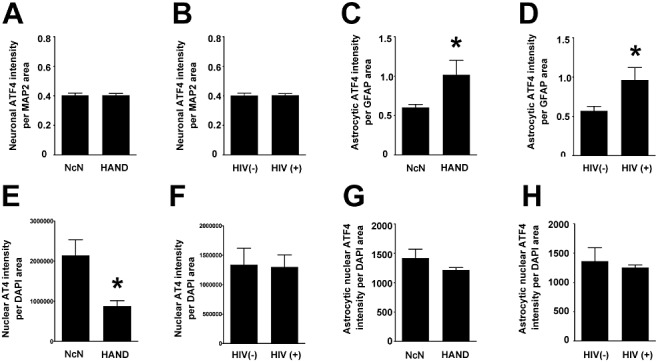
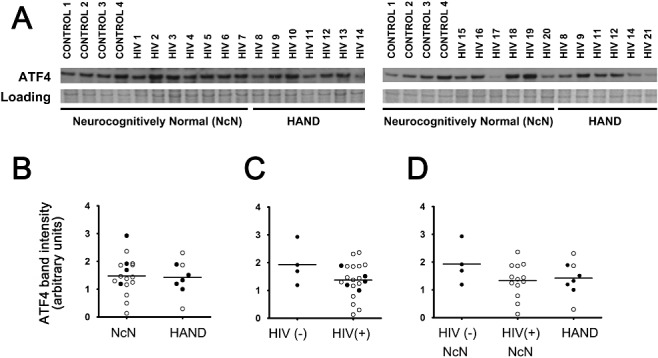
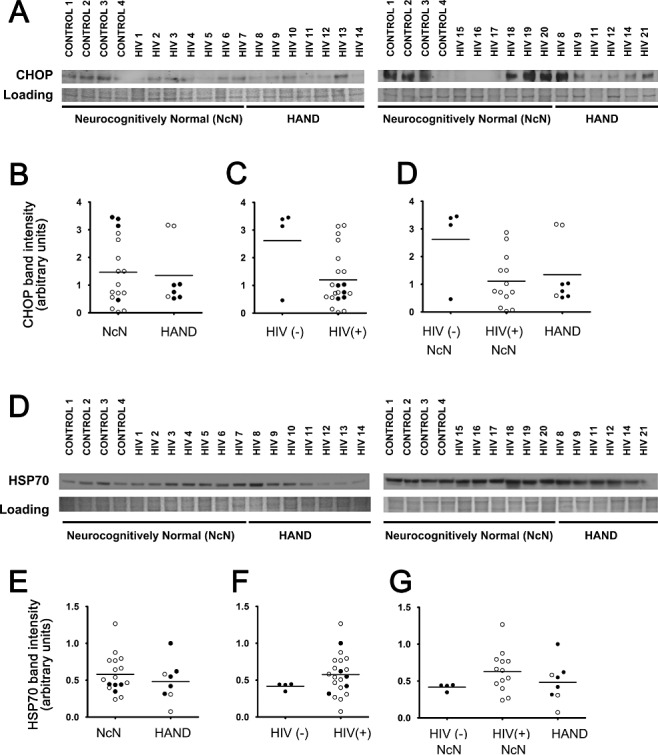
Methods: To further elucidate the specific ISR pathways activated in the central nervous system of HAND patients, we examined the protein levels of several ISR proteins, including ATF6, peIF2α and ATF4, in cortical tissue from HIV-infected patients.

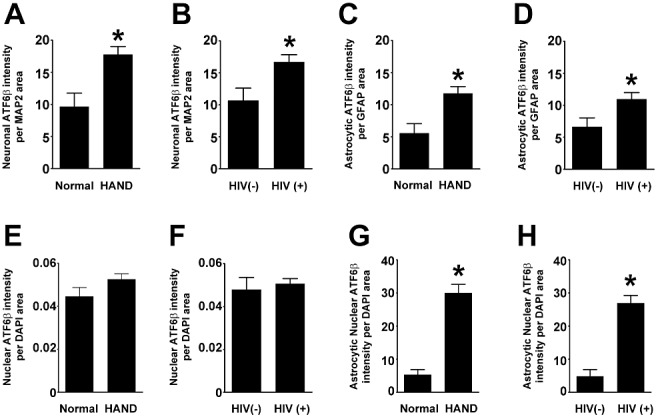
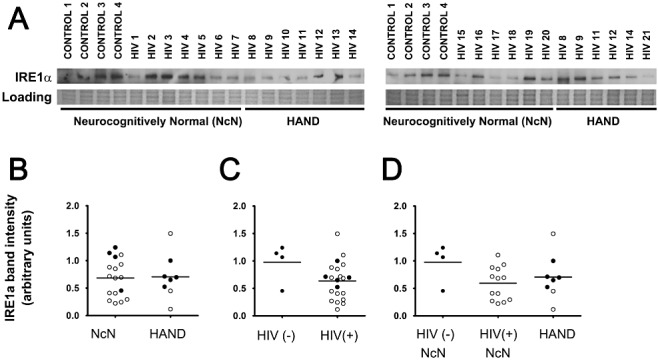
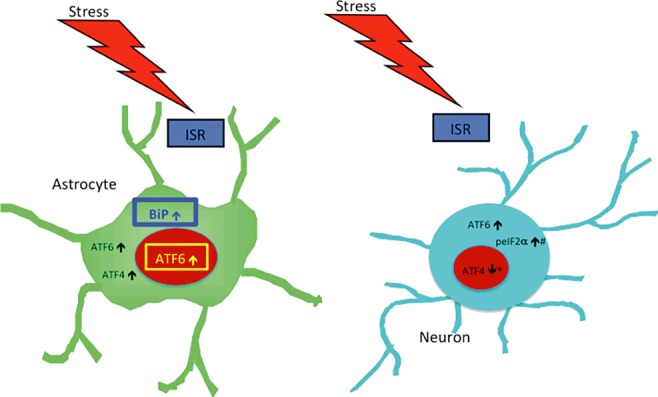
Results: The ISR does not respond in an all-or-none fashion in HAND, but rather demonstrates a nuanced activation pattern. Specifically, our studies implicate the ATF6 pathway of the ISR as a more likely candidate than the PERK pathway for increases in BiP levels in astrocytes.

Conclusion: These findings begin to characterize the nature of the ISR response in HAND and provide potential targets for therapeutic intervention in this disease.


Figures

Figure 1
Figure 1
ATF6β increases in mid‐frontal cortical grey matter of patients with HAND and of patients infected with HIV. Formalin‐fixed, paraffin‐embedded mid‐frontal cortical autopsy tissue was quadruple labelled with antibodies for ATF6β and for the cell‐type markers for astrocytes (GFAP) and for neurones (MAP2), as well as the DNA‐binding compound, DAPI to label nuclei. (A) Grey matter in labelled slides was imaged using laser confocal microscopy: ATF6β is shown in green, GFAP and MAP2 are shown in red and are not both present in the same images, and DAPI is shown in blue. Overlap of ATF6β with a cell‐type marker appears yellow. ATF6β overlap with DAPI appears blue‐green. An example is shown for an HIV(−) uninfected control, an HIV(+) neurocognitively normal case, and a HAND case for each cell‐type marker. The third panel shows higher magnification images of astrocytes, which are denoted by asterisks [HIV(−) control] or arrowheads [HIV(+) cases]. (B and C) ATF6β integrated pixel intensity from confocal images (five per case) was quantified using Metamorph 6.0 software. Total ATF6β intensity increases in HAND cases (n = 12) over neurocognitively normal (NcN) cases (n = 5) (B) and in HIV(+) cases (n = 14) over HIV(−) (n = 3) controls (C). Values are shown as mean ± SEM. Student's t‐test and Mann–Whitney U post‐hoc analysis was used for statistical analysis to determine significance. *P < 0.05, compared with control.
Figure 2
Figure 2
Neuronal and astrocytic ATF6β increases in HAND and in HIV(+) compared with neurocognitively normal and HIV(−) tissue, respectively, while nuclear ATF6β increases only in HAND tissue. Using Metamorph 6.0 software, total integrated pixel intensity of ATF6β was quantified and colocalization with cell‐type markers was determined and normalized to area of cell‐type marker to account for losses of cell‐type marker protein due to disease. (A and B) ATF6β increases in the cytoplasm of neurones in both HAND cases and HIV(+) cases when compared to neurocognitively normal (NcN) and HIV(−) cases, respectively. (C and D) ATF6β increases in the cytoplasm of astrocytes in both HAND cases and HIV(+) cases when compared to neurocognitively normal (NcN) and HIV(−) cases, respectively. (E and F) Total nuclear ATF6β levels do not increase in HAND cases over neurocognitively normal (NcN) cases or in HIV(+) cases over that seen in HIV(−). (G and H) Astrocytic nuclear ATF6β levels increase in both HAND cases and HIV(+) cases when compared to neurocognitively normal (NcN) and HIV(−) cases, respectively. Values are shown as mean ± SEM. Student's t‐test and Mann–Whitney U post‐hoc analysis was used for statistical analysis to determine significance. *P < 0.05, compared with control.
Figure 3
Figure 3
Total ATF6α increases in HAND tissue as observed via immunoblotting. Whole‐cell protein extracts were isolated from fresh‐frozen cortical autopsy tissue and were used for assessment of ATF6α protein levels. (A) Blots showing ATF6α levels in autopsy tissue, as well as a band from Coomassie staining of the PVDF membrane: HIV(−)/neurocognitively normal (control), HIV(+)/neurocognitively normal, and HAND. (B) ATF6α expression is increased in the mid‐frontal cortices of HAND cases (n = 8) compared with neurocognitively normal (NcN) cases (n = 17). Samples were run on two separate blots due to large number of sample sizes. Several cases were run on both blots to serve as technical replicates. For quantification, band intensities were first normalized to loading controls. Then, all samples on both blots were normalized to sample HIV 8 from their respective blot for comparison across blots. HIV 8 was used for normalization because it was run in the centre of the blot and was therefore unlikely to have any confounding factors due to proximity to the edge of the gel. For cases run on both gels, normalized values were averaged and are represented using closed circles. Cases run on only one gel are represented using open circles. (C) ATF6α levels did not significantly change in HIV(+) (n = 21) tissue compared with HIV(−) (control) tissue (n = 4). (D) Cases were divided into three groups: (i) HIV(−)/neurocognitively normal; (ii) HIV(+)/neurocognitively normal; and (iii) HAND. Groups were compared using one‐way anova and no significant differences were found. Coomassie staining of the PVDF membrane was used as a loading control for normalization of protein levels for quantification and statistical analysis as shown in BD. #P < 0.05, compared with control, Student's t‐test for two‐way comparisons and one‐way anova for three‐way comparisons and Mann–Whitney U post‐hoc analysis.
Figure 4
Figure 4
IRE1α levels do not change across experimental groups when examined via immunoblot analysis. Whole‐cell protein extracts were isolated from fresh‐frozen cortical autopsy tissue and were used for assessment of IRE1α protein levels. (A) Blots showing IRE1α levels in autopsy tissue, as well as a band from Coomassie staining of the PVDF membrane: HIV(−)/neurocognitively normal (control), HIV(+)/neurocognitively normal, and HAND. (B) IRE1α expression does not change in the mid‐frontal cortices of HAND cases (n = 8) compared with neurocognitively normal (NcN) cases (n = 17). Samples were run on two separate blots due to large number of sample sizes. Quantification was conducted as described for ATF6α in the Figure 3 legend. For cases run on both gels, normalized values were averaged and are represented using closed circles. Cases run on only one gel are represented using open circles. (C) IRE1α levels did not significantly change in HIV(+) (n = 21) tissue compared with HIV(−) (control) tissue (n = 4). (D) Cases were divided into three groups: (i) HIV(−)/neurocognitively normal; (ii) HIV(+)/neurocognitively normal; and (iii) HAND. Groups were compared using one‐way anova and no significant differences were found. Coomassie staining of the PVDF membrane was used as a loading control for normalization of protein levels for quantification and statistical analysis as shown in BD. Student's t‐test for two‐way comparisons and one‐way anova for three‐way comparisons and Mann–Whitney U post‐hoc analysis.
Figure 5
Figure 5
Total and neuronal peIF2α increase in HIV(+) tissue compared with HIV(−) tissue. Cortical autopsy tissue was quadruple labelled for peIF2α, GFAP, MAP2 and DAPI. (A) Grey matter in labelled slides was imaged using laser confocal microscopy: peIF2α is shown in green, GFAP and MAP2 are shown in red, and DAPI is shown in blue. Overlap of peIF2α with a cell‐type marker appears yellow and with DAPI appears blue‐green. An example is shown for an HIV(−) case, and HIV(+) neurocognitively normal case, and for a HAND case for each cell‐type marker. (BE) peIF2α levels from confocal images (five per case) were quantified by determining integrated pixel intensity using Metamorph 6.0 software. Total and cytoplasmic neuronal peIF2α increases in HIV(+) cases (n = 13) over HIV(−) cases (n = 4) (C and F) and in HAND cases (n = 7) over neurocognitively normal cases (n = 10); however, the increase is quite small, despite reaching significance (B and E). (D and G) Cases were divided into three groups: (i) HIV(−)/neurocognitively normal; (ii) HIV(+)/neurocognitively normal; and (iii) HAND. Groups were compared using one‐way anova and HIV(+) cases, both neurocognitively normal (n = 6) and HAND (n = 7), were found to increase significantly over HIV(−) cases (n = 4). HAND cases, n = 7; neurocognitively normal cases, n = 10; HIV(+) cases, n = 13; HIV(−), n = 4. Values are shown as mean ± SEM. Student's t‐test was used for two‐way comparison and one‐way anova was used for three‐way comparisons and Mann–Whitney U post‐hoc analysis was used for statistical analysis to determine significance. *P < 0.05, compared with control.
Figure 6
Figure 6
Total peIF2α increases in HIV(+) tissue as observed via immunoblotting. Whole‐cell protein extracts were isolated from fresh‐frozen cortical autopsy tissue and were used for assessment of peIF2α protein levels. (A) Blots showing peIF2α levels in autopsy tissue, as well as a band from Coomassie staining of the PVDF membrane: HIV(−)/neurocognitively normal (control), HIV(+)/neurocognitively normal, and HAND. (B) peIF2α expression does not change in the mid‐frontal cortices of HAND cases (n = 8) compared with neurocognitively normal (NcN) cases (n = 17). Samples were run on two separate blots due to large number of sample sizes. Quantification was conducted as described for ATF6α in the Figure 3 legend. For cases run on both gels, normalized values were averaged and are represented using closed circles. Cases run on only one gel are represented using open circles. (C) peIF2α levels increased significantly in HIV(+) (n = 21) tissue compared with HIV(−) (control) tissue (n = 4). (D) Cases were divided into three groups: (i) HIV(−)/neurocognitively normal; (ii) HIV(+)/neurocognitively normal; and (iii) HAND. Groups were compared using one‐way anova and no significant differences were found. Coomassie staining of the PVDF membrane was used as a loading control for normalization of protein levels for quantification and statistical analysis as shown in BD. #P < 0.05, Student's t‐test for two‐way comparisons and one‐way anova for three‐way comparisons and Mann–Whitney U post‐hoc analysis.
Figure 7
Figure 7
Total ATF4 decreases in HAND tissue compared with neurocognitively normal tissue. Paraffin‐embedded cortical autopsy tissue was quadruple labelled for ATF4, GFAP, MAP2 and DAPI. (A) Grey matter in labelled slides was imaged using laser confocal microscopy: ATF4 is shown in green, GFAP and MAP2 are shown in red, and DAPI is shown in blue. Overlap of ATF4 with a cell‐type marker appears yellow. ATF4 overlap with DAPI appears blue‐green. An example is shown for an HIV(−) uninfected control, an HIV(+) neurocognitively normal case, and a HAND case for each cell‐type marker. The third panel shows higher magnification images of astrocytes, which are denoted by asterisks [HIV(−) control] or arrowheads [HIV(+) cases]. (B and C) ATF4 protein levels from confocal images (five per case) were quantified by determining integrated pixel intensity using Metamorph 6.0 software. Total ATF4 decreases in HAND cases (n = 12) over neurocognitively normal cases (n = 5), but shows no change in HIV(+) cases (n = 14) compared with HIV(−) (n = 3) controls (C). Values are shown as mean ± SEM. Student's t‐test and Mann–Whitney U post‐hoc analysis was used for statistical analysis to determine significance. *P < 0.05, compared with control.
Figure 8
Figure 8
While total nuclear ATF4 protein levels parallel total ATF4 protein levels, cytoplasmic neuronal ATF4 and nuclear astrocytic ATF4 do not change with disease state and cytoplasmic astrocytic ATF4 increases in both HAND and HIV(+) tissue compared with neurocognitively normal and HIV(−) tissue, respectively. Using Metamorph 6.0 software, total integrated pixel intensity of ATF4 was quantified and colocalization with cell‐type markers was determined and normalized to area of cell‐type marker to account for losses of marker protein due to disease. (A and B) Neuronal cytoplasmic ATF4 does not change with disease state. (C and D) ATF4 in the cytoplasm of astrocytes increases in both HAND cases and HIV(+) cases when compared to neurocognitively normal and HIV(−) cases, respectively. (E and F) Total nuclear ATF4 protein levels decrease in HAND cases over neurocognitively normal cases, but do not change in HIV(+) cases over that seen in HIV(−) cases. (G and H) Astrocytic nuclear ATF4 levels do not change in either HAND or HIV(+) cases when compared to neurocognitively normal or HIV(−) cases, respectively. Values are shown as mean ± SEM. Student's t‐test and Mann–Whitney U post‐hoc analysis was used for statistical analysis to determine significance. *P < 0.05, compared with control.
Figure 9
Figure 9
ATF4 levels do not change across experimental groups when examined via immunoblot analysis. Whole‐cell protein extracts were isolated from fresh‐frozen cortical autopsy tissue and were used for assessment of ATF4 protein levels. (A) Blots showing ATF4 levels in autopsy tissue, as well as a band from Coomassie staining of the PVDF membrane: HIV(−)/neurocognitively normal (control), HIV(+)/neurocognitively normal, and HAND. (B) ATF4 expression does not change in the mid‐frontal cortices of HAND cases (n = 8) compared with neurocognitively normal (NcN) cases (n = 17). Samples were run on two separate blots due to large number of sample sizes. Quantification was conducted as described for ATF6α in the Figure 3 legend. For cases run on both gels, normalized values were averaged and are represented using closed circles. Cases run on only one gel are represented using open circles. (C) ATF4 levels did not significantly change in HIV(+) (n = 21) tissue compared with HIV(−) (control) tissue (n = 4). (D) Cases were divided into three groups: (i) HIV(−)/neurocognitively normal; (ii) HIV(+)/neurocognitively normal; and (iii) HAND. Groups were compared using one‐way anova and no significant differences were found. Coomassie staining of the PVDF membrane was used as a loading control for normalization of protein levels for quantification and statistical analysis as shown in BD. Student's t‐test for two‐way comparisons and one‐way anova for three‐way comparisons and Mann–Whitney U post‐hoc analysis.
Figure 10
Figure 10
CHOP and HSP70 levels do not change across experimental groups when examined via immunoblot analysis. Whole‐cell protein extracts were isolated from fresh‐frozen cortical autopsy tissue and were used for assessment of CHOP and HSP70 protein levels. (A and D) Blots showing CHOP (A) and HSP70 (D) levels in autopsy tissue, as well as a band from Coomassie staining of the PVDF membrane: HIV(−)/neurocognitively normal (control), HIV(+)/neurocognitively normal, and HAND. (B and E) CHOP and HSP70 expression levels do not change in the mid‐frontal cortices of HAND cases (n = 8) compared with neurocognitively normal (NcN) cases (n = 17). Samples were run on two separate blots due to large number of sample sizes. Quantification was conducted as described for ATF6α in the Figure 3 legend. For cases run on both gels, normalized values were averaged and are represented using closed circles. Cases run on only one gel are represented using open circles. (C and F) CHOP and HSP70 levels did not significantly change in HIV(+) (n = 21) tissue compared with HIV(−) (control) tissue (n = 4). (D and G) Cases were divided into three groups: (i) HIV(−)/neurocognitively normal; (ii) HIV(+)/neurocognitively normal; and (iii) HAND. Groups were compared using one‐way anova and no significant differences were found for either CHOP or HSP70. Coomassie staining of the PVDF membrane was used as a loading control for normalization of protein levels for quantification and statistical analysis as shown in BD. Student's t‐test for two‐way comparisons and one‐way anova for three‐way comparisons and Mann–Whitney U post‐hoc analysis.
Figure 11
Figure 11
Diagram summarizing results of total protein levels for each protein examined. For ISR proteins outlined with green boxes, we observed increased protein levels. Specifically, for ATF6 and peIF2α we saw increases in both HAND and HIV(+) tissue compared with respective control groups when compared via IFA. When compared via immunoblot, ATF6 increased in HAND tissue over NcN tissue when compared via immunoblot, while peIF2α increased in HIV(+) tissue when compared with HIV(−) tissue. BiP (outlined in a dashed green box) was analysed previously [52] and increased via IFA and immunoblot. For proteins outlines with orange boxes, we saw no change. Specifically, IRE1α, CHOP and HSP70 showed no change across groups by immunoblot. ATF4 showed no change across groups by immunoblot, and showed no change in HIV(+) tissue over HIV(−) tissue via IFA. ATF is also outlined with a red box indicating that its levels decreased in HAND tissue compared with neurocognitively normal tissue via IFA.
Figure 12
Figure 12
Diagram summarizing results of cell type‐specific protein levels for each protein examined. Changes observed in nuclear and cytoplasmic compartments are indicated in each cell‐type examined (neurones and astrocytes). Of particular interest, ATF6β in the only transcription we observed to increase in the nucleus of astrocytes, making it a particularly promising candidate as the ISR initiator protein responsible for our previously observed increase in astrocytic BiP levels [52]. Note, only proteins that exhibited a change in protein levels are indicated and not all proteins were examined for both subcellular compartments in both cell types (see chart 1 for reference). #: only determined for neurones because GFAP staining was not of a quality and consistency to allow for quantification of colocalization using this marker; *: indicates increase observed in total nuclear ATF4 levels, but because this staining was predominantly neuronal nuclei it was likely indicative of neuronal nuclear ATF4.

Similar articles

Cited by

References

    1. Akay L, Coye MJ. Implementing an employee portal. Taking steps toward a ‘paperless’ future. Healthplan 2001; 42: 66–9 - PubMed
    1. McArthur JC, Haughey N, Gartner S, Conant K, Pardo C, Nath A, Sacktor N. Human immunodeficiency virus‐associated dementia: an evolving disease. J Neurovirol 2003; 9: 205–21 - PubMed
    1. Simioni S, Cavassini M, Annoni JM, Rimbault Abraham A, Bourquin I, Schiffer V, Calmy A, Chave JP, Giacobini E, Hirschel B, Du Pasquier RA. Cognitive dysfunction in HIV patients despite long‐standing suppression of viremia. AIDS 2010; 24: 1243–50 - PubMed
    1. Gorry PR, Ong C, Thorpe J, Bannwarth S, Thompson KA, Gatignol A, Vesselingh SL, Purcell DF. Astrocyte infection by HIV‐1: mechanisms of restricted virus replication, and role in the pathogenesis of HIV‐1‐associated dementia. Curr HIV Res 2003; 1: 463–73 - PubMed
    1. Kaul M, Zheng J, Okamoto S, Gendelman HE, Lipton SA. HIV‐1 infection and AIDS: consequences for the central nervous system. Cell Death Differ 2005; 12 (Suppl. 1): 878–92 - PubMed

Publication types

MeSH terms

Substances