. 2011 Nov;24(11):2410-22.
doi: 10.1111/j.1420-9101.2011.02369.x. Epub 2011 Aug 23.

The fitness of drug-resistant malaria parasites in a rodent model: multiplicity of infection

Affiliations

The fitness of drug-resistant malaria parasites in a rodent model: multiplicity of infection

S Huijben et al. J Evol Biol. 2011 Nov.

Abstract

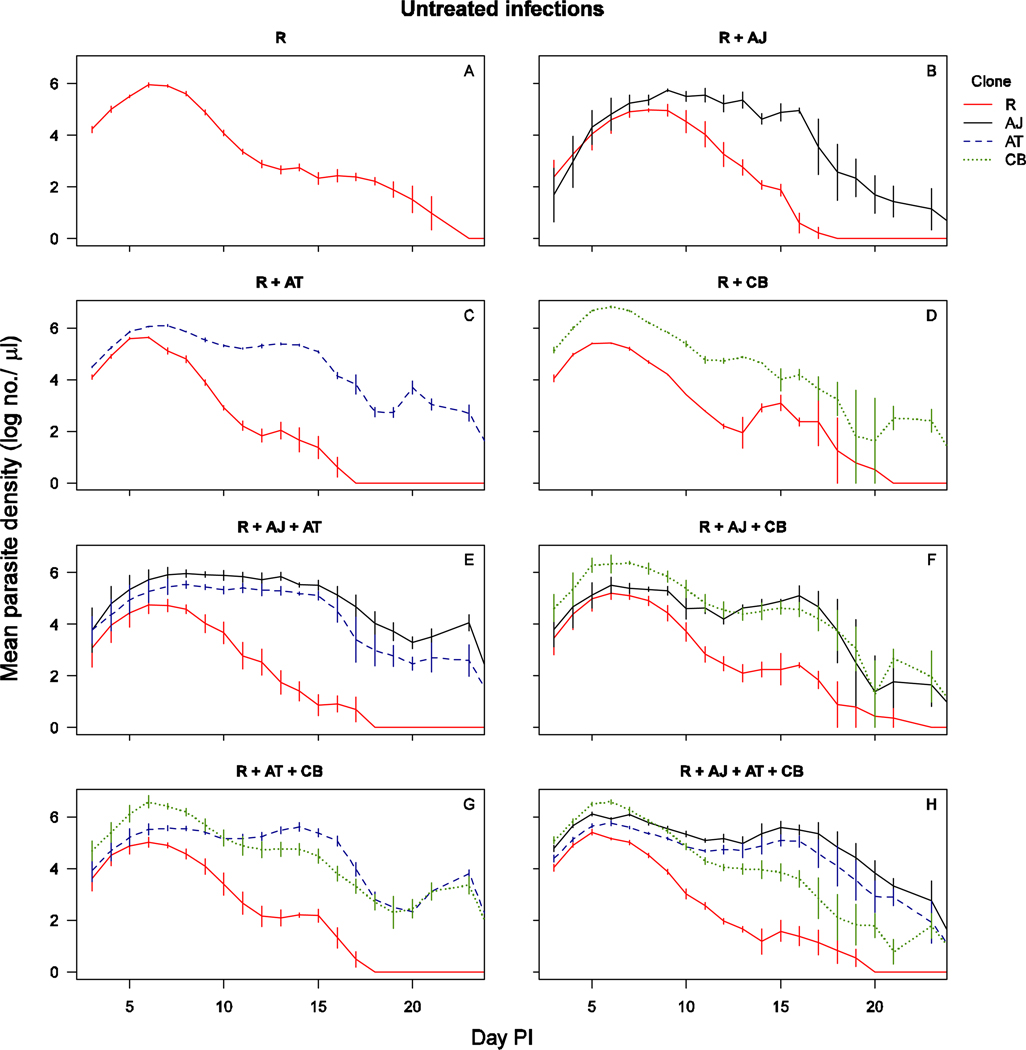
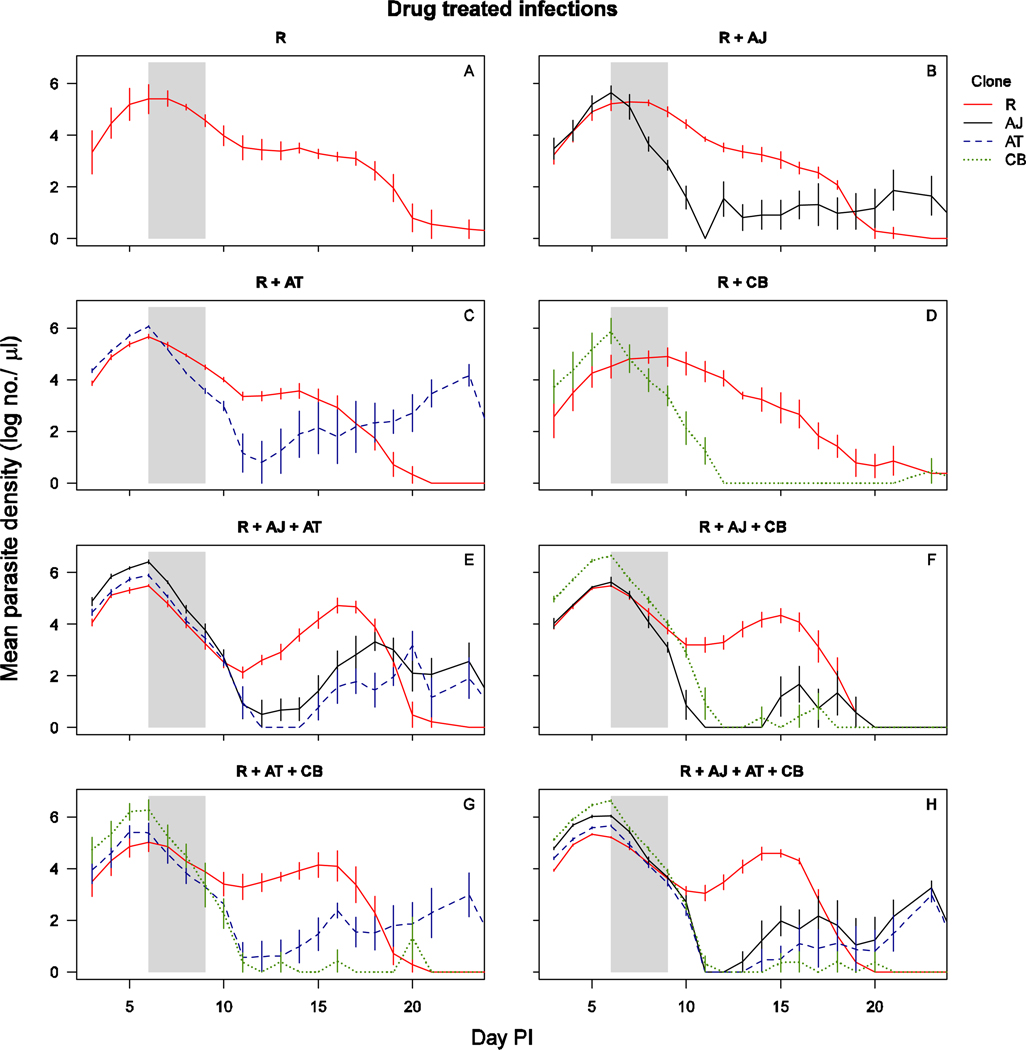
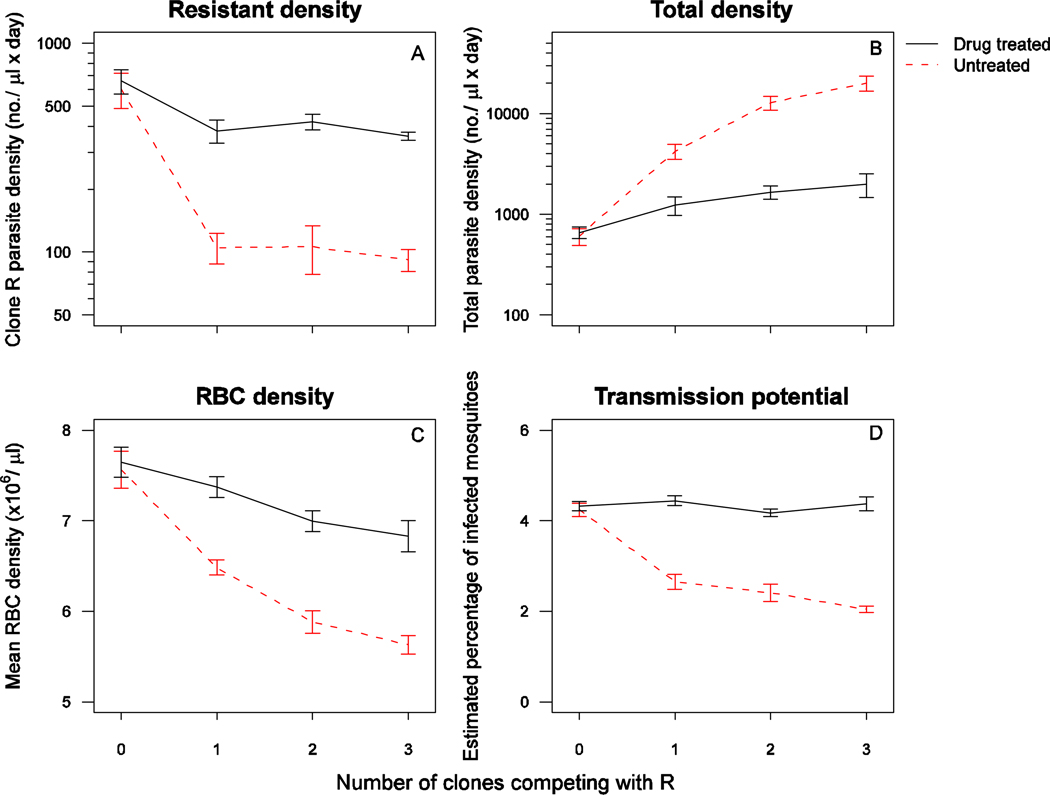
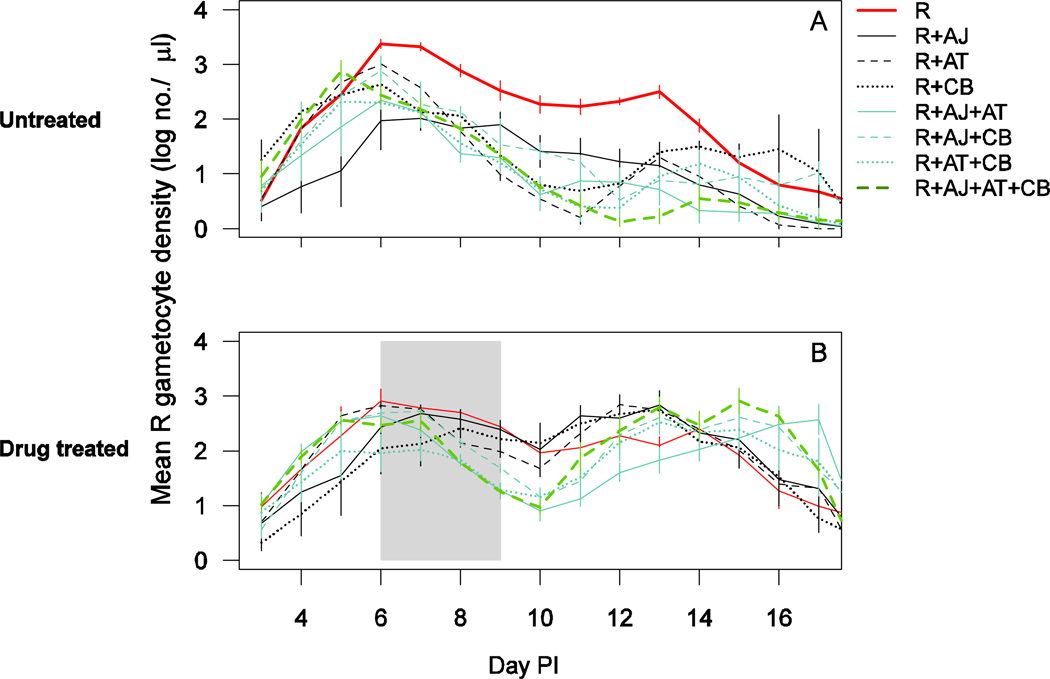
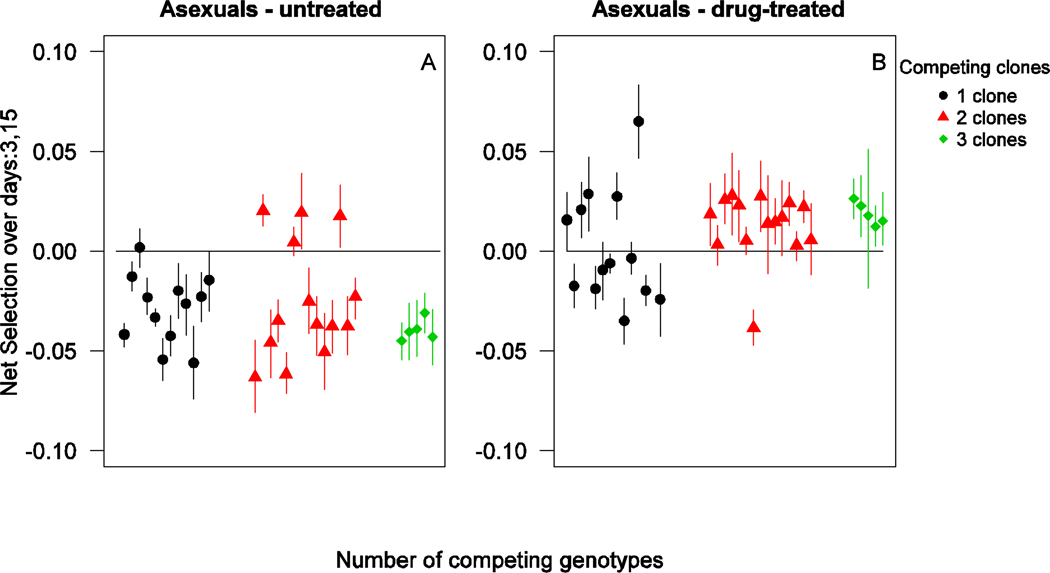
Malaria infections normally consist of more than one clonally replicating lineage. Within-host interactions between sensitive and resistant parasites can have profound effects on the evolution of drug resistance. Here, using the Plasmodium chabaudi mouse malaria model, we ask whether the costs and benefits of resistance are affected by the number of co-infecting strains competing with a resistant clone. We found strong competitive suppression of resistant parasites in untreated infections and marked competitive release following treatment. The magnitude of competitive suppression depended on competitor identity. However, there was no overall effect of the diversity of susceptible parasites on the extent of competitive suppression or release. If these findings generalize, then transmission intensity will impact on resistance evolution because of its effect on the frequency of mixed infections, not because of its effect on the distribution of clones per host. This would greatly simplify the computational problems of adequately capturing within-host ecology in models of drug resistance evolution in malaria.


Figures

Figure 1
Figure 1
Parasite dynamics of untreated infections of clone(s): R alone (a), R with AJ (b), R with AT (c), R with CB (d), R with AJ and AT (e), R with AJ and CB (f), R with AT and CB (g), R with AJ, AT and CB (h). The total parasite densities for clone R are shown in solid red line, for clone AJ in solid black line, for clone AT in dashed blue line and for clone CB in dotted green line. Data are means (± standard error) of up to 6 mice (table 1). The mixed infection of R with CB consisted of only two surviving mice.
Figure 2
Figure 2
Parasite dynamics of drug treated infections of clone(s): R alone (a), R with AJ (b), R with AT (c), R with CB (d), R with AJ and AT (e), R with AJ and CB (f), R with AT and CB (g), R with AJ, AT and CB (h). The total parasite densities for clone R are shown in solid red line, for clone AJ in solid black line, for clone AT in dashed blue line and for clone CB in dotted green line. Data are means (± standard error) of 5 mice (table 1). Drug treatment was given on days 6–9 post-infection, as indicated by the shaded area.
Figure 3
Figure 3
Geometric mean daily parasite density of clone R (A), geometric mean daily total parasite density of all clones combined (B), mean daily red blood cell density (C) and estimated percentage of infected mosquitoes of clone R (D), in drug treated (solid black line) and untreated (dashed red 27 line) infections of either clone R alone (0 competing clones) or in a co-infection with 1, 2 or 3 other clones. Data are means (± standard error) for the entire infection period (panel A and C, day 3–35 PI), for the period with recorded susceptible parasite densities (panel B, day 323) or for the post-treatment period with gametocyte data (panel D, day 7–17). Note the y-axis varies between the left panel plots.
Figure 4
Figure 4
Gametocyte dynamics of clone R (day 3–17) in untreated (a) and drug treated (b) infections of clone R alone (solid thick red line), R with AJ (solid black line), R with AT (dashed black line), R with CB (dotted black line), R with AJ and AT (solid blue line), R with AJ and CB (dashed blue line), R with AT and CB (dotted blue line) and R with AJ, AT and CB (thick dashed green line). Drug treatment was given on days 6–9 post-infection. Data are means (± standard error) of up to six mice (table 1). The mixed infection of R with CB consisted of only two surviving mice.
Figure 5
Figure 5
Net selection on clone R competing with one (black circles), two (red triangles) and three (green squares) susceptible genotypes over days 3–15 in untreated (left panel) and drug-treated (right panel) infections. Each datapoint represents a mean value (± 95% confidence interval) of bootstrap replicates for an individual mouse.

References

    1. A-Elbasit IE, ElGhazali G, A-Elgadir TME, Hamad AA, Babiker HA, Elbashir MI, Giha HA. Allelic polymorphism of MSP2 gene in severe P. falciparum malaria in an area of low and seasonal transmission. Parasitol Res. 2007;102:29–34. - PubMed
    1. Abdel-Muhsin AMA, Mackinnon MJ, Ali E, Nassir EKA, Suleiman S, Ahmed S, Walliker D, Babiker HA. Evolution of drug-resistance genes in Plasmodium falciparum in an area of seasonal malaria transmission in Eastern Sudan. J Infect Dis. 2004;189:1239–1244. - PubMed
    1. Alonso PL, Djimde A, Kremsner P, Magill A, Milman J, Najera J, Plowe CV, Rabinovich R, Wells T, Yeung S, ma ICGD. A research agenda for malaria eradication: drugs. PLoS Med. 2011;8:e1000402. - PMC - PubMed
    1. Anderson RM, May RM. Infectious diseases of humans. Oxford, U.K.: Oxford University Press; 1991.
    1. Antao T. Evolutionary parasitology applied to control and elimination policies. Trends Parasitol. 2011;27:233–234. - PubMed

Publication types