. 2012 Aug;16(8):1686-700.
doi: 10.1111/j.1582-4934.2011.01441.x.

Analysis of microdissected neurons by 18O mass spectrometry reveals altered protein expression in Alzheimer's disease

Affiliations

Analysis of microdissected neurons by 18O mass spectrometry reveals altered protein expression in Alzheimer's disease

Masakazu Hashimoto et al. J Cell Mol Med. 2012 Aug.

Abstract

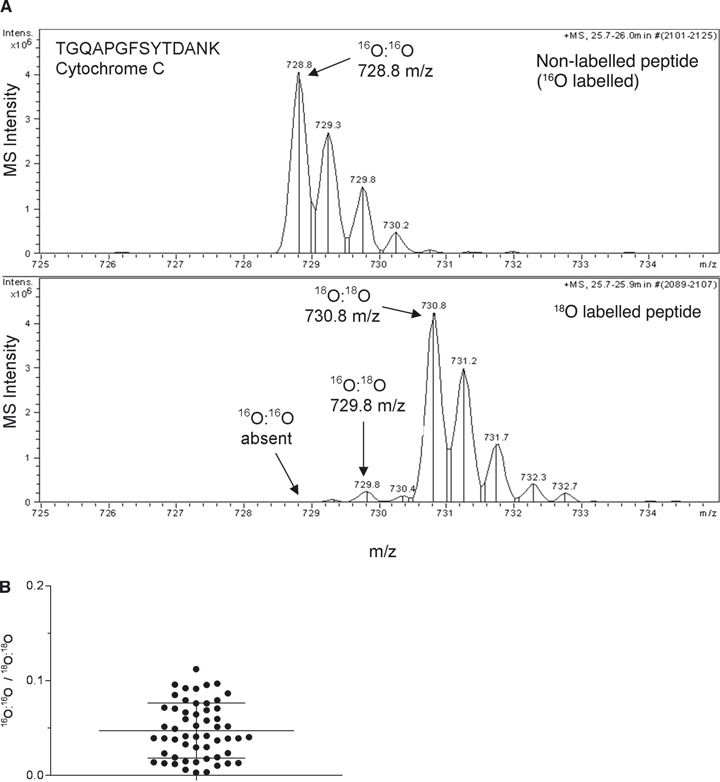
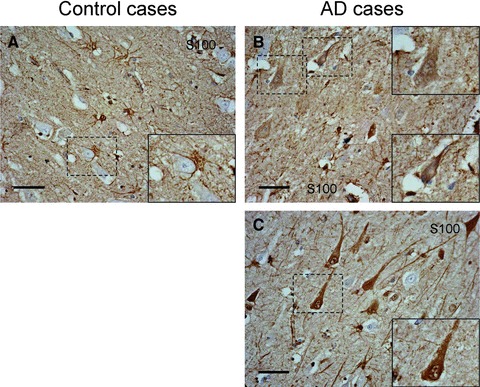
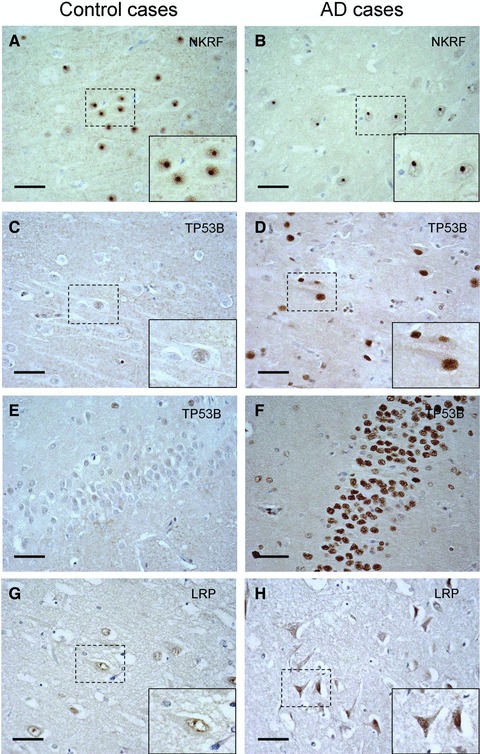
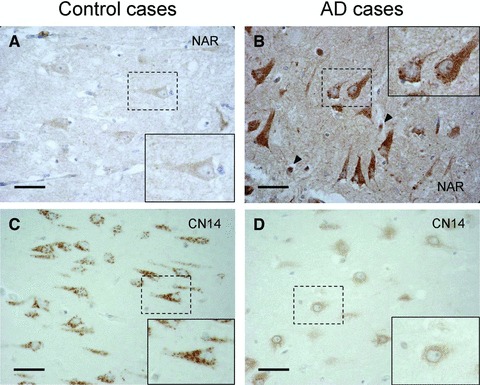
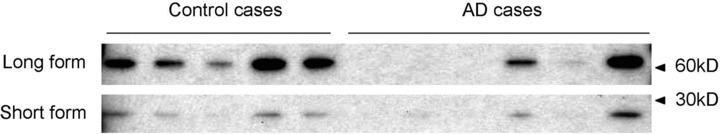
It is evident that the symptoms of Alzheimer's disease (AD) are derived from severe neuronal damage, and especially pyramidal neurons in the hippocampus are affected pathologically. Here, we analysed the proteome of hippocampal neurons, isolated from post-mortem brains by laser capture microdissection. By using (18)O labelling and mass spectrometry, the relative expression levels of 150 proteins in AD and controls were estimated. Many of the identified proteins are involved in transcription and nucleotide binding, glycolysis, heat-shock response, microtubule stabilization, axonal transport or inflammation. The proteins showing the most altered expression in AD were selected for immunohistochemical analysis. These analyses confirmed the altered expression levels, and showed in many AD cases a pathological pattern. For comparison, we also analysed hippocampal sections by Western blot. The expression levels found by this method showed poor correlation with the neuron-specific analysis. Hence, we conclude that cell-specific proteome analysis reveals differences in the proteome that cannot be detected by bulk analysis.


Figures

Fig 1
Fig 1
18O labelling of tryptic peptides. (A) Non-labelled (upper) or 18O labelled (lower) MS spectrum from Cytochrome C. A sample from hippocampal CA1 sections was labelled in H216O or H218O. The tryptic peptides were injected into the LC-MS system (Agilent 6330). Peptide identification was performed by MASCOT search. Note the low level of unlabelled peptide in the lower panel. (B) The ratios of unlabelled versus double-labelled peptide in an 18O labelled sample. In the randomly selected 54 MS spectra, the average ratio of non-labelled (16O:16O) and double-labelled peptide (18O:18O) was 0.047 (B). The mean ± S.D. is expressed by lines.
Fig 2
Fig 2
S100B staining in the CA1 region. (A) Control, case number 6. (B, C) Sporadic AD cases, case numbers 9 and 8, respectively (Table 1). Magnification of originals: 40χ. Magnification of insets: 70χ. Scale bar corresponds to 50 μm.
Fig 3
Fig 3
NKRF, TP53B and LRP1 staining in CA1 region. (A, B) NKRF in CA1; (C, D) TP53B in CA1; (E, F) TP53B in gyrus dentatus; (G, H) LRP1 in CA1; (A, C, E, G) Controls, case number 2, 3, 3 and 6, respectively. (B, D, F, H) Sporadic AD, case numbers 9, 10, 10 and 9, respectively. These proteins were detected in nucleolus in AD cases. Magnification of originals: 40χ. Magnification of insets: 70χ. Scale bar corresponds to 50 μm.
Fig 4
Fig 4
NCF4, microglia marker and CAPON staining in CA1 region. (A–C) NCF4; (D, E) Microglia; (F, G) CAPON; (A, D, F) Controls, case numbers 3, 3 and 6, respectively. (B, C, E, G) Sporadic AD, case numbers 7, 10, 10 and 9, respectively. An antibody against HLA-DP DQ DR was used for the detection of microglia. Arrow heads in (A) and (B) indicate immunoreactivity in blood cells. Magnification of originals: 40χ. Magnification of insets: 70χ. Scale bar corresponds to 50 μm.
Fig 5
Fig 5
NAR4 and CN145 staining in CA1 region. (A, B) NAR4; (C, D) CN145; (A, C) Controls, cases numbers 6 and 4, respectively. (B, D) Sporadic AD, case number 9 in both. Arrow heads in B indicate immunoreactivity in blood cells. Magnification of originals: 40χ. Magnification of insets: 70χ. Scale bar corresponds to 50 μm.
Fig 6
Fig 6
Western blot analysis of CAPON expression in the CA1 region. The samples prepared from the CA1 region were loaded and separated on a 4–12% SDS-PAGE gel. Detection of CAPON was performed by the sc-9138 antibody, and visualized by SuperSignal® West Dura. The bands correspond to the long form (upper bands) and short form (lower bands) of CAPON.

Similar articles

Cited by

References

    1. Wenk GL. Neuropathologic changes in Alzheimer's disease. J Clin Psychiatry. 2003;64:7–10. - PubMed
    1. Hashimoto M, Rockenstein E, Crews L, et al. Role of protein aggregation in mitochondrial dysfunction and neurodegeneration in Alzheimer's and Parkinson's diseases. Neuromol Med. 2003;4:21–36. - PubMed
    1. Tiraboschi P, Hansen LA, Thal LJ, et al. The importance of neuritic plaques and tangles to the development and evolution of AD. Neurology. 2004;62:1984–9. - PubMed
    1. Braak H, Braak E. Neuropathological staging of Alzheimer-related changes. Acta Neuropathol. 1991;82:239–59. - PubMed
    1. Gygi SP, Rochon Y, Franza BR, et al. Correlation between protein and mRNA abundance in yeast. Mol Cell Biol. 1999;19:1720–30. - PMC - PubMed

Publication types

MeSH terms