. 2011 Nov;89(7):e579-90.
doi: 10.1111/j.1755-3768.2011.02167.x. Epub 2011 Aug 23.

Two separate Ni(2+) -sensitive voltage-gated Ca(2+) channels modulate transretinal signalling in the isolated murine retina

Affiliations
Free PMC article

Two separate Ni(2+) -sensitive voltage-gated Ca(2+) channels modulate transretinal signalling in the isolated murine retina

Maged Alnawaiseh et al. Acta Ophthalmol. 2011 Nov.
Free PMC article

Abstract

Purpose: Light-evoked responses from vertebrate retinas were recorded as an electroretinogram (ERG). The b-wave is the most prominent component of the ERG, and in the bovine retina its NiCl(2) -sensitive component was attributed to reciprocal signalling by pharmacoresistant R-type voltage-gated Ca(2+) channels, which similar to other voltage-dependent Ca(2+) channels trigger and control neurotransmitter release. The murine retina has the great advantage that the effect of gene inactivation for Ni(2+) -sensitive Ca(2+) channels can be analysed to prove or disprove that any of these Ca(2+) channels is involved in retinal signalling.

Methods: Superfused retinas from different murine genotypes lacking either one or both highly Ni(2+) -sensitive voltage-gated Ca(2+) channels were used to record their ex vivo ERGs.

Results: The isolated retinas from mice lacking Ca(v)2.3 R-type or Ca(v)3.2 T-type or both voltage-gated Ca(2+) channels were superfused with a NiCl(2) (15 μm) containing nutrient solution. The change in the b-wave amplitude and implicit time, caused by NiCl(2), was calculated as a difference spectrum and compared to data from control animals. From the results, it can be deduced that Ca(v)2.3 contributes rather to a later component in the b-wave response, while in the absence of Ca(v)3.2 the gain of Ni(2+) -mediated increase in the b-wave amplitude is significantly increased, probably due to a loss of reciprocal inhibition to photoreceptors. Thus, each of the Ni(2+)-sensitive Ca(2+) channels contributes to specific features of the b-wave response.

Conclusion: Both high-affinity Ni(2+)-sensitive Ca(2+) channels contribute to transretinal signalling. Based on the results from the double knockout mice, additional targets for NiCl(2) must contribute to transretinal signalling, which will be most important for the structurally similar physiologically more important heavy metal cation Zn(2+).


Figures

Fig. 1
Fig. 1
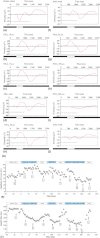
(A). Dual effects of NiCl2 on the murine electroretinogram (ERG) b-wave. ERG recording (preincubation protocol for 4 hr, see Materials and Methods) and plot of the b-wave amplitude (panel B) and implicit time (panel C) after flashes of light (0.5 seconds, 63 mlx). Light-evoked responses were recorded every 3 min. Superfusion of nutrient solution at a flow rate of 2 ml/min. Small letters in panel (B) indicate individual ERG traces, which are shown in panel (A). (A) Individual ERG recordings from the time points as indicated in panel (B) and (C). Note, the black-and-white bar under each ERG denotes the time when the light flash occurs. (B) After reaching equilibrium of a stable b-wave amplitude, NiCl2 was added as indicated to the perfusing solution at 10 and subsequently at 15 μm, which was washed out. At 50 μm NiCl2, a lower and transient increase in the b-wave amplitude was observed, which after another washout was finally inhibited at 100 and 200 μm NiCl2. (C) Plot over time of the implicit times from the ERGs shown in panel (B).
Fig. 2
Fig. 2
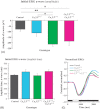
Analysis and comparison of initial electroretinogram (ERG) signals of all four murine genotypes before adding NiCl2. (A) Initial ERG recording before adding NiCl2 were dominated by the presence of a-waves with different amplitudes, which are plotted for each genotype. Mean values were taken from 4 to 6 individual retinas from each genotype and are presented with SEM values. (B) Implicit times were plotted as mean values plus SEM (n = 4–6) for each genotype. (C) Normalized current traces were calculated from mean values and are superimposed for all genotypes.
Fig. 3
Fig. 3
Increase in b-wave amplitude at low (15 μm) NiCl2 after only a short pre-equilibration (30 min) period. Individual electroretinogram recordings from control mice at the indicated time intervals were superimposed (panel A), and the b-wave amplitude was plotted versus time after adding 15 μm NiCl2 to the nutrient solution (panel B). Note, that maximal amplitude of the b-wave is reached after 30 min of superfusion, while the apparent a-wave is reduced dramatically.
Fig. 4
Fig. 4
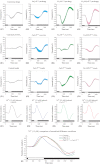
Comparison of the changes for the b-wave amplitude at low (15 μm) NiCl2 and after washout (short pre-equilibration of 30 min). Individual electroretinogram (ERG) traces were calculated as mean traces for control mice (panel A1–D1), for Cav2.3-deficient mice (panel A2–D2), for Cav3.2-deficient mice (panel A3–D3) and for double knockout mice (panel A4–D4). The upper line of panels summarizes the mean ERG traces before NiCl2 application (panel A1–D1), the second line of panels represents the mean traces after adding NiCl2 for 30 min (panel B1–B4), and the third line of panels shows the washout mean traces (panel C1–C4). In the fourth line (panel D1–D4), the differences for each genotype are plotted as normalized mean ERG trace. The flash of light (as in all other experiments for 0.5 second at 63 mlx) is indicated by the white bar. In panel (E), the four normalized ERG traces from the D-panel line are superimposed for the shorter time interval as indicated.
Fig. 5
Fig. 5
Summary of implicit times and mean amplitudes for the murine electroretinogram (ERG) b-wave at low (15 μm) NiCl2 (short pre-equilibration of 30 min). (A) Implicit times for the four genotypes as indicated are calculated from the normalized mean ERG traces as shown in Fig. 4D1–D4. (B) Mean b-wave amplitudes for the four genotypes as indicated are calculated from the difference traces as shown in Fig. 4C1–C4. *Significant differences (Student’s t-test, p < 0.05) are labelled by an asterisk.

Similar articles

Cited by

References

    1. Albanna W, Banat M, Albanna N, et al. Longer lasting electroretinographic recordings from the isolated and superfused murine retina. Graefes Arch Clin Exp Ophthalmol. 2009;247:1339–1352. - PubMed
    1. Ball SL, Gregg RG. Using mutant mice to study the role of voltage-gated calcium channels in the retina. Adv Exp Med Biol. 2002;514:439–450. - PubMed
    1. Barnes S, Kelly ME. Calcium channels at the photoreceptor synapse. Adv Exp Med Biol. 2002;514:465–476. - PubMed
    1. Bech-Hansen NT, Naylor MJ, Maybaum TA, et al. Loss-of-function mutations in a calcium-channel a1-subunit gene in Xp11.23 cause incomplete X-linked congenital stationary night blindness. Nat. Genet. 1998;19:264–267. - PubMed
    1. Catterall WA. Structure and regulation of voltage-gated Ca2+ channels. Annu. Rev. Cell Dev. Biol. 2000;16:521–555. - PubMed

Publication types