. 2011 Apr 24;1(1):12.
doi: 10.1186/2043-9113-1-12.

Peripheral blood gene expression profiles in COPD subjects

Affiliations

Peripheral blood gene expression profiles in COPD subjects

Soumyaroop Bhattacharya et al. J Clin Bioinforma. .

Abstract

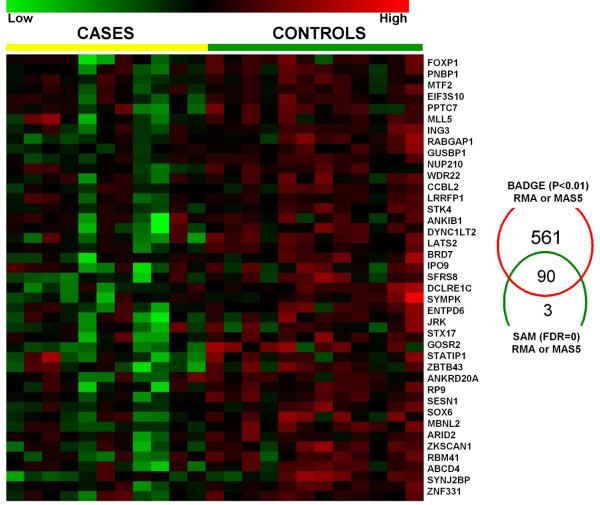
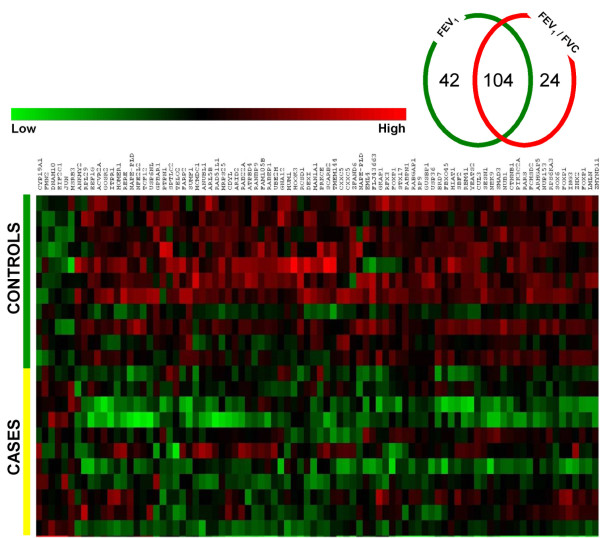
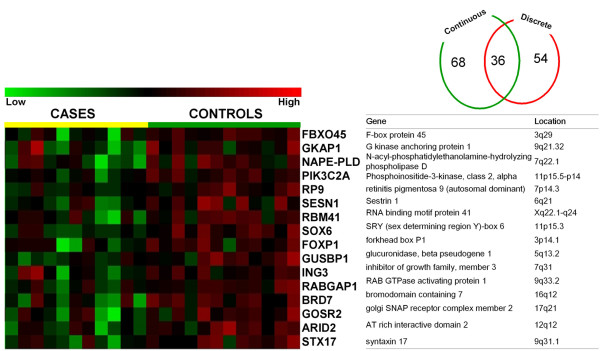
To identify non-invasive gene expression markers for chronic obstructive pulmonary disease (COPD), we performed genome-wide expression profiling of peripheral blood samples from 12 subjects with significant airflow obstruction and an equal number of non-obstructed controls. RNA was isolated from Peripheral Blood Mononuclear Cells (PBMCs) and gene expression was assessed using Affymetrix U133 Plus 2.0 arrays.Tests for gene expression changes that discriminate between COPD cases (FEV1< 70% predicted, FEV1/FVC < 0.7) and controls (FEV1> 80% predicted, FEV1/FVC > 0.7) were performed using Significance Analysis of Microarrays (SAM) and Bayesian Analysis of Differential Gene Expression (BADGE). Using either test at high stringency (SAM median FDR = 0 or BADGE p < 0.01) we identified differential expression for 45 known genes. Correlation of gene expression with lung function measurements (FEV1 & FEV1/FVC), using both Pearson and Spearman correlation coefficients (p < 0.05), identified a set of 86 genes. A total of 16 markers showed evidence of significant correlation (p < 0.05) with quantitative traits and differential expression between cases and controls. We further compared our peripheral gene expression markers with those we previously identified from lung tissue of the same cohort. Two genes, RP9and NAPE-PLD, were identified as decreased in COPD cases compared to controls in both lung tissue and blood. These results contribute to our understanding of gene expression changes in the peripheral blood of patients with COPD and may provide insight into potential mechanisms involved in the disease.


Figures

Figure 1
Figure 1
Discrete biomarkers. Shown are signal intensity measurements for each of the annotated 45 genes (from 90 probe sets) identified as significantly differentially expressed between cases and controls using both Significance Analysis of Microarrays (SAM) and Bayesian Analysis of Differential Gene Expression (BADGE). Data from individual subjects are in columns and data for individual genes are in rows. Signal intensity data are color-coded such that the intensity of red indicates a relatively high level of expression, while the intensity of green represents a relatively low level of expression (as indicated on scale).
Figure 2
Figure 2
Quantitative biomarkers. Shown are signal intensity measurements for 86 annotated genes (among the 104 probe sets) identified as significantly correlated with FEV1%predicted and FEV1/FVC at P < 0.05. Data from individual subjects are in rows and data for individual genes are in columns. Signal intensity data are color-coded such that the intensity of red indicates a relatively high level of expression, while the intensity of green represents a relatively low level of expression.
Figure 3
Figure 3
Biomarkers for both discrete and quantitative phenotypes. Shown are signal intensity measurements for the 16 genes (among 36 probe sets) identified as significantly different between cases and controls and significantly correlated with both FEV1%predicted and FEV1/FVC. Data from individual subjects are in columns and data for individual genes are in rows. Signal intensity data are color-coded such that the intensity of red indicates a relatively high level of expression, while the intensity of green represents a relatively low level of expression. Complete gene names and chromosomal locations are listed.
Figure 4
Figure 4
Functional Classification. (A) Gene Ontology categories significantly overrepresented in peripheral COPD biomarkers (EASE score < 0.05). Given are GO category name and number, the percentage of genes within the category for COPD markers (black bars) or all genes tested (open bars) and the EASE scores for the category. Number of genes in each category is shown on the bars. (B) Canonical pathways associated with COPD peripheral gene expression markers identified by Ingenuity Pathway Analysis. Shown here are top ten significantly affected canonical pathways, the percentage of genes within the pathway for COPD markers (black bars) or all genes tested (open bars) and the Fisher Exact p-values scores for the pathway. Number of genes in each category is shown on the bars.

References

    1. National Institutes of Health National Heart L, and Blood Institute. 2009 Chart Book on Cardiovascular, Lung, and Blood Diseases. 2009.
    1. Chen JC, Mannino DM. Worldwide epidemiology of chronic obstructive pulmonary disease. Curr Opin Pulm Med. 1999;5(2):93–99. doi: 10.1097/00063198-199903000-00003. - DOI - PubMed
    1. Murtagh E, Heaney L, Gingles J, Shepherd R, Kee F, Patterson C, MacMahon J. Prevalence of obstructive lung disease in a general population sample: the NICECOPD study. Eur J Epidemiol. 2005;20(5):443–453. doi: 10.1007/s10654-005-1248-8. - DOI - PubMed
    1. Barnes PJ. Chronic obstructive pulmonary disease. N Engl J Med. 2000;343(4):269–280. doi: 10.1056/NEJM200007273430407. - DOI - PubMed
    1. Hogg JC, Chu F, Utokaparch S, Woods R, Elliott WM, Buzatu L, Cherniack RM, Rogers RM, Sciurba FC, Coxson HO. et al. The nature of small-airway obstruction in chronic obstructive pulmonary disease. N Engl J Med. 2004;350(26):2645–2653. doi: 10.1056/NEJMoa032158. - DOI - PubMed

LinkOut - more resources