Comparative Study
. 2011 Nov;59(6):787-803.
doi: 10.1016/j.neuint.2011.08.009. Epub 2011 Aug 23.

Expression profiling reveals differential gene induction underlying specific and non-specific memory for pheromones in mice

Affiliations
Comparative Study

Expression profiling reveals differential gene induction underlying specific and non-specific memory for pheromones in mice

Sudarshan C Upadhya et al. Neurochem Int. 2011 Nov.

Abstract

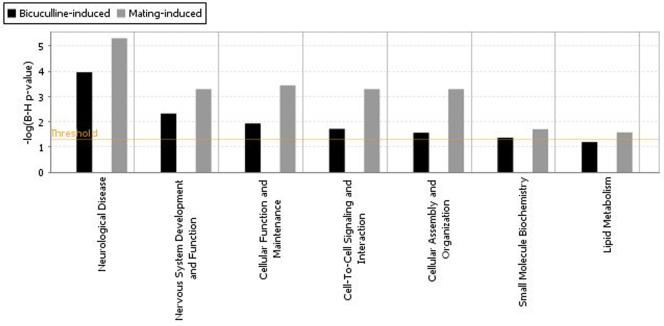
Memory for the mating male's pheromones in female mice is thought to require synaptic changes in the accessory olfactory bulb (AOB). Induction of this memory depends on release of glutamate in response to pheromonal exposure coincident with release of norepinephrine (NE) in the AOB following mating. A similar memory for pheromones can also be induced artificially by local infusion of the GABA(A) receptor antagonist bicuculline into the AOB. The natural memory formed by exposure to pheromones during mating is specific to the pheromones sensed by the female during mating. In contrast, the artificial memory induced by bicuculline is non-specific and results in the female mice recognizing all pheromones as if they were from the mating male. Although protein synthesis has been shown to be essential for development of pheromone memory, the gene expression cascades critical for memory formation are not known. We investigated changes in gene expression in the AOB using oligonucleotide microarrays during mating-induced pheromone memory (MIPM) as well as bicuculline-induced pheromone memory (BIPM). We found the set of genes induced during MIPM and BIPM are largely non-overlapping and Ingenuity Pathway Analysis revealed that the signaling pathways in MIPM and BIPM also differ. The products of genes induced during MIPM are associated with synaptic function, indicating the possibility of modification at specific synapses, while those induced during BIPM appear to possess neuron-wide functions, which would be consistent with global cellular changes. Thus, these results begin to provide a mechanistic explanation for specific and non-specific memories induced by pheromones and bicuculline infusion respectively.


Figures

Fig. 1
Fig. 1
Hierarchical cluster plot showing patterns of gene expression in the AOB induced during bicuculine-induced pheromone memory (BIPM) and mating-induced pheromone memory (MIPM). Fluorescent log ratios of significant probe sets for BIPM (Panel A) and MIPM (Panel B) assigned by the statistical analysis with adjusted fold induction cut off value of 1.1 were subjected to hierarchical clustering to identify clustering within groups. Fluorescent log ratio is the logarithm of the ratio of a given gene’s expression level in AOB of animals that underwent MIPM or BIPM to that particular gene’s expression level in the reference state (untreated AOB). Horizontal rows of pixels represent different genes. The columns represent comparison between controls vs. experimental conditions. For example, in Panel A, C4-BICU4 is the gene expression in a bicuculline (BICU4) treated (BIPM) AOB compared to the gene expression in the control AOB treated with CSF (C4). In Panel B, gene expression in the AOB of an experimental animal (E1) that underwent MIPM is compared to gene expression in the AOB of a control animal (C13) (n=4 for BIPM & n=5 for MIPM). Each gene is represented by a single column or cell. Gene with fluorescent log ratios of 0 are colored black, increasingly positive log ratios with reds of increasing intensity, and increasingly negative log ratios with greens of increasing intensity. A dendrogram is shown at left of cluster plot to indicate the nature of the computed relationship among genes in the table. We observed two non-matching hierarchical trees between genes induced during BIPM and MIPM suggesting that different set of genes are induced in the two different memory pathways.
Fig. 2
Fig. 2
Validation of microarray data by real-time PCR. Quantification of levels of mRNA expression of dynein, kinesin and Cdk5r1 by real-time PCR showing significant (*P<0.05; n=4; student t-test) induction of these mRNAs with mating-induced pheromone memory. 18s rRNA was used as control. The expression levels of all three genes were calculated after normalization to expression of 18S rRNA.
Fig. 3
Fig. 3
Immunocytochemistry showing increased expression of Cdk5r1 in the AOB during MIPM. Control (Top panels): The figure shows confocal images of anti-Cdk5r1 immunoreactivity in the AOB (top middle). Nuclei were counterstained with TOPRO-3 iodide which stains double-stranded nucleic acids (top left). The first two panels are ‘merged’ in the top third panel. Experimental (Bottom panels): Confocal images of anti-Cdk5r1 (bottom middle) TOPRO-3 (bottom left) and merged (bottom right) of AOB from animals that underwent MIPM. GC: granule cell layer; MC/EPL: mitral cell/external plexiform layer; LOT/IPL: lateral olfactory tract/internal plexiform layer; Scale bar: 20 μm.
Fig. 4
Fig. 4
Immunocytochemistry showing increased expression of PKCα in the AOB during MIPM. Control (Top panels): The figure shows confocal images of anti-PKCα immunoreactivity in the AOB (top middle). Nuclei were counterstained with TOPRO-3 iodide which stains double-stranded nucleic acids (top left). The longish red TOPRO-3 stains probably resulted from squishing of cells together in a slightly distorted section. The first two panels are ‘merged’ in the top third panel. Experimental (Bottom panels): Confocal images of anti-PKCα (bottom middle) TOPRO-3 (bottom left) and merged (bottom right) of AOB from animals that underwent MIPM. GC: granule cell layer; MC/EPL: mitral cell/external plexiform layer; LOT/IPL: lateral olfactory tract/internal plexiform layer; Scale bar: 20 μm.
Fig. 5
Fig. 5
Immunocytochemistry showing increased expression of eEF1A in the AOB during MIPM. Control (Top panels): The figure shows confocal images of anti-eEF1A immunoreactivity in the AOB (top middle). Nuclei were counterstained with TOPRO-3 iodide which stains double-stranded nucleic acids (top left). The first two panels are ‘merged’ in the top third panel. Experimental (Bottom panels): Confocal images of anti-eEF1A (bottom middle) TOPRO-3 (bottom left) and merged (bottom right) of AOB from animals that underwent MIPM. MC/EPL: mitral cell/external plexiform layer; LOT/IPL: lateral olfactory tract/internal plexiform layer; GC: granule cell layer. Scale bar: 20 μm.
Fig. 6
Fig. 6
Quantification of increase in expression of Cdk5r1, PKCα, and eEF1A during MIPM. (A) Cdk5r1 immunoreactivity was significantly (P<0.001; n=6; Student’s t-test) higher in both mitral cell (MC) and granule cell (GC) layers of the AOB during MIPM compared to controls. (B) eEF1A immunoreactivity was significantly (P<0.01; n=4; Student’s t-test) higher in both MC and GC layers of the AOB during MIPM compared to controls. (C) PKCα immunoreactivity was significantly (P<0.01; n=4; Student’s t-test) higher in both MC and GC layers of the AOB during MIPM compared to controls. AU: Arbitrary units. Notation on Y-axis: 2e+5 = 2 × 10⁵; 1e+6= 1 × 10⁶ etc.
Fig. 7
Fig. 7
Analysis of Biological Functional Pathways underlying BIPM and MIPM. Biofunctional analysis was carried out using IPA knowledge Base database. Bar chart representing the significant changes in the seven functional categories among genes induced in the AOB during BIPM and MIPM. The functional categories are displayed along the x-axis, and the y-axis indicates the significance score (negative log of p-value calculated using Benjamini-Hochberg multiple-score test). The horizontal yellow line indicates the significance threshold. The significance threshold of pathways was set to 1.3 (derived by −log10 [p-value], whereas p≥0.05). Functional categories below the threshold line are not significant. Our result shows the statistically significant association (p<0.05) of genes induced in the AOB during BIMP and MIPM among top seven biofunction catagories (neurological disease etc as indicated along the x-axis). The bar chart also shows the higher significance value (lower Benjamini-Hochberg p-value) and higher number of focus molecules for genes induced during MIPM relative to the genes induced during BIPM in all seven functional categories
Fig. 8
Fig. 8
Differential expression of canonical pathway molecules during BIPM and MIPM. Significant canonical pathways as determined by using Ingenuity Pathway Knowledge Base functional analysis tools are displayed along the x-axis. The y-axis displays the significance score (negative log of p-value calculated using right-tailed Fisher Exact Test). The yellow threshold line that appears in the bar chart represents a p-value of 0.05. The significance threshold of pathways was set to 1.3 (derived by −log10 [P-value], whereas P≤0.05). Canonical pathways below the threshold line are not statistically significant. Beyond the threshold, the taller bars represent participation of higher number of genes in the pathway compared to shorter bars. (A) Genes induced during MIPM displaying higher statistical significance value (low p-value) or stronger association to the canonical pathways (Huntington’s disease signaling, 14-3-3 mediated signaling, GABA receptor signaling, CXCR4 signaling and axon guidance signaling) compared to genes induced during BIPM. (B) Bar chart showing the significant association of mating induced genes to the canonical pathways like neuregulin signaling, synaptic long-term potentiation, cAMP-mediated signaling, G-protein coupled receptor signaling, α-adrenergic signaling, and oxidative phosphorylation. The genes in these pathways are expressed only in during MIPM. (C) Graph showing the significant association of genes induced during BIPM with the canonical pathways like neurotrophin.TRK signaling, protein ubiquitination pathway, regulation of actin-based motiliy by Rho and PI3K/AKT signaling. Association with these pathways among genes induced during MIPM is either absent or statistically not significant.
Fig. 9
Fig. 9
Differential association of 14-3-3 mediated signaling among genes induced during BIPM compared to the genes induced during MIPM. Canonical pathway diagram representing 14-3-3 mediated signaling pathways matched to the network eligible genes induced during BIPM (A) and network eligible genes induced during MIPM (B). Mitogen-activated protein kinase 5 (ASK1), glial fibrillary acidic protein (GFAP), tubulin, microtubule-associated protein tau (Tau) and c-Fos show significant association with this pathway in BIPM dataset. Glial fibrillary acidic protein (GFAP), tubulin, glycogen synthase kinase 3 (GSK3A), protein kinase C (PKC) and tyrosine 3-monooxygenase/tryptophan 5-monooxygenase activation protein (14-3-3, YWHA1) show significant association with this pathway in the MIPM dataset. Red color nodes represent genes that appear in the bicuculline or mating dataset. Greater intensity of red represents a higher degree of upregulation.
Fig. 10
Fig. 10
Differential participation of GABA receptor signaling molecules in BIPM and MIPM. Canonical pathway diagram representing GABA receptor signaling pathways matched to the bicuculline induced network eligible genes (A) and mating induced network eligible genes (B). GABA receptor A (GABAR-A) and ubiquitin (Ub) show significant association with this pathway in the BIPM dataset. Glutamic decarboxylase (GAD), ubiquitin (Ub) and dynamin 1 (DNM1) show significant association with this pathway in MIPM dataset. Red color nodes represent genes that appear in the bicuculline or mating dataset. The intensity of red node color indicates the degree of expression. Nodes are displayed using various shapes that represent the functional class of the genes or gene product (diamond=enzymes, ovals=transcription factors, triangle=kinases, circles=others). A solid line indicates a direct interaction while a dashed line indicates an indirect interaction. A line without an arrowhead indicates binding.

Similar articles

Cited by

References

    1. Abrams TW, Karl KA, Kandel ER. Biochemical studies of stimulus convergence during classical conditioning in Aplysia: dual regulation of adenylate cyclase by Ca2+/calmodulin and transmitter. J. Neurosci. 1991;11:2655–2665. - PMC - PubMed
    1. Bao J, Wolpowitz D, Role LW, Talmage DA. Back signaling by the Nrg-1 intracellular domain. J. Cell Biol. 2003;161:1133–1141. - PMC - PubMed
    1. Bedford FK, Kittler JT, Muller E, Thomas P, Uren JM, Merlo D, Wisden W, Triller A, Smart TG, Moss SJ. GABA(A) receptor cell surface number and subunit stability are regulated by the ubiquitin-like protein Plic-1. Nat. Neurosci. 2001;4:908–916. - PubMed
    1. Benjamini Y, Hochberg Y. Controlling the False Discovery Rate: A Practical and Powerful Approach to Multiple Testing. Journal of the Royal Statistical Society. Series B (Methodological) 1995;57:289–300.
    1. Bramham CR, Messaoudi E. BDNF function in adult synaptic plasticity: the synaptic consolidation hypothesis. Prog. Neurobiol. 2005;76:99–125. - PubMed

Publication types

Substances