. 2011 Sep 2;9(3):219-32.
doi: 10.1016/j.stem.2011.07.015.

Genome-wide maps of histone modifications unwind in vivo chromatin states of the hair follicle lineage

Affiliations

Genome-wide maps of histone modifications unwind in vivo chromatin states of the hair follicle lineage

Wen-Hui Lien et al. Cell Stem Cell. .

Abstract

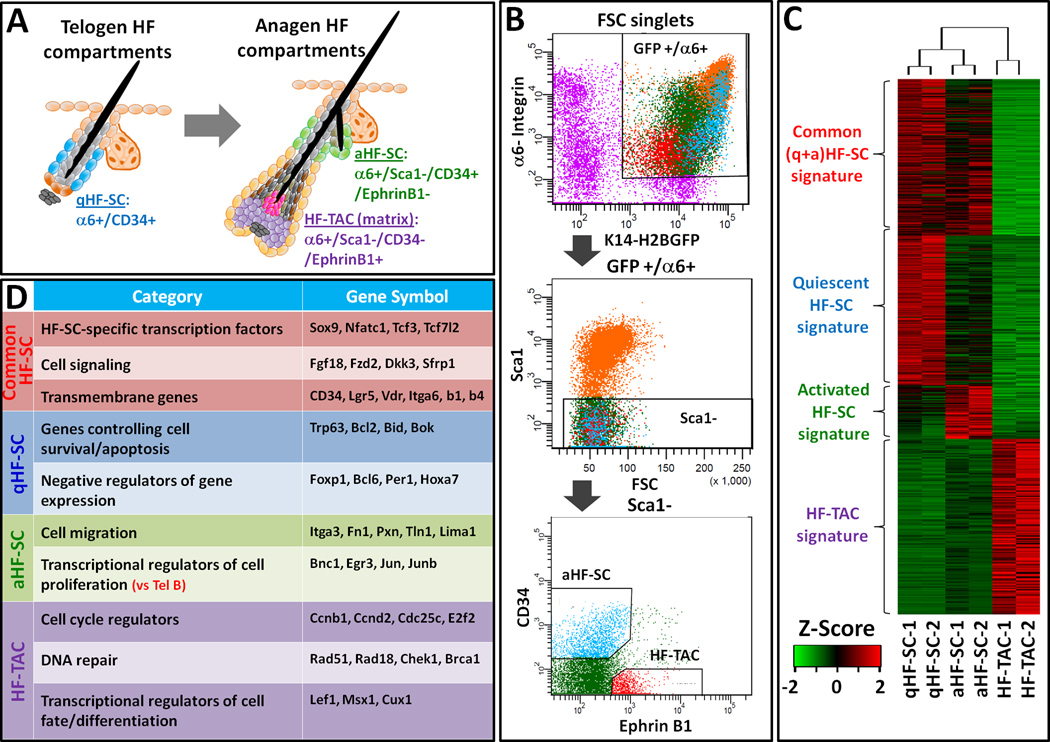
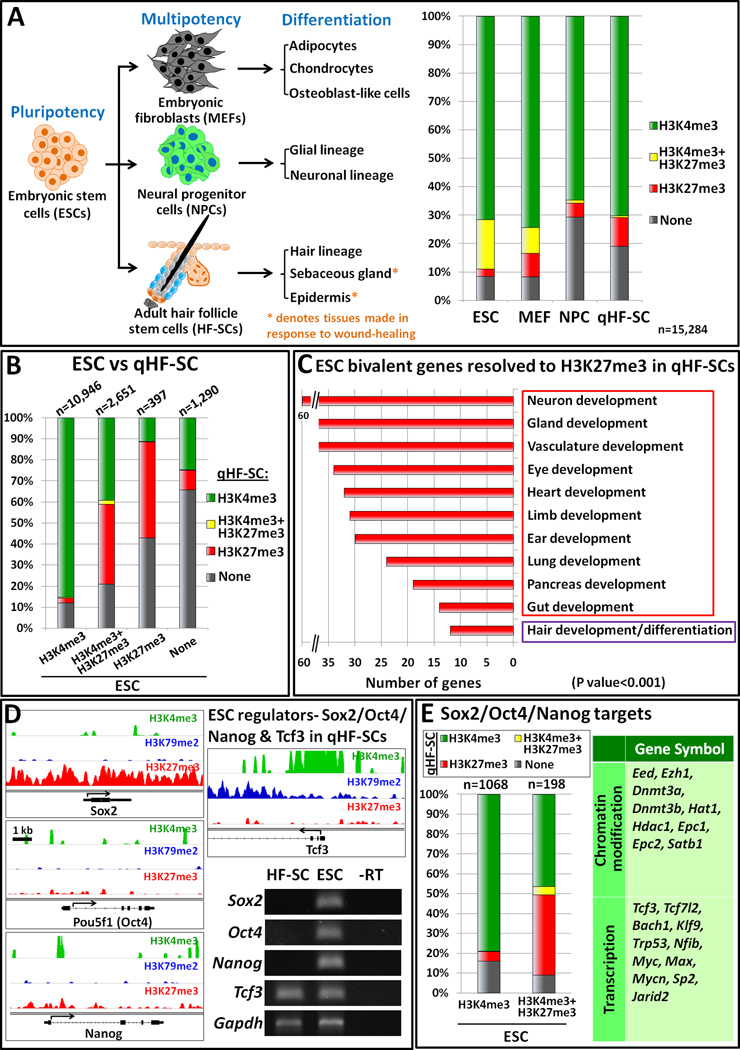
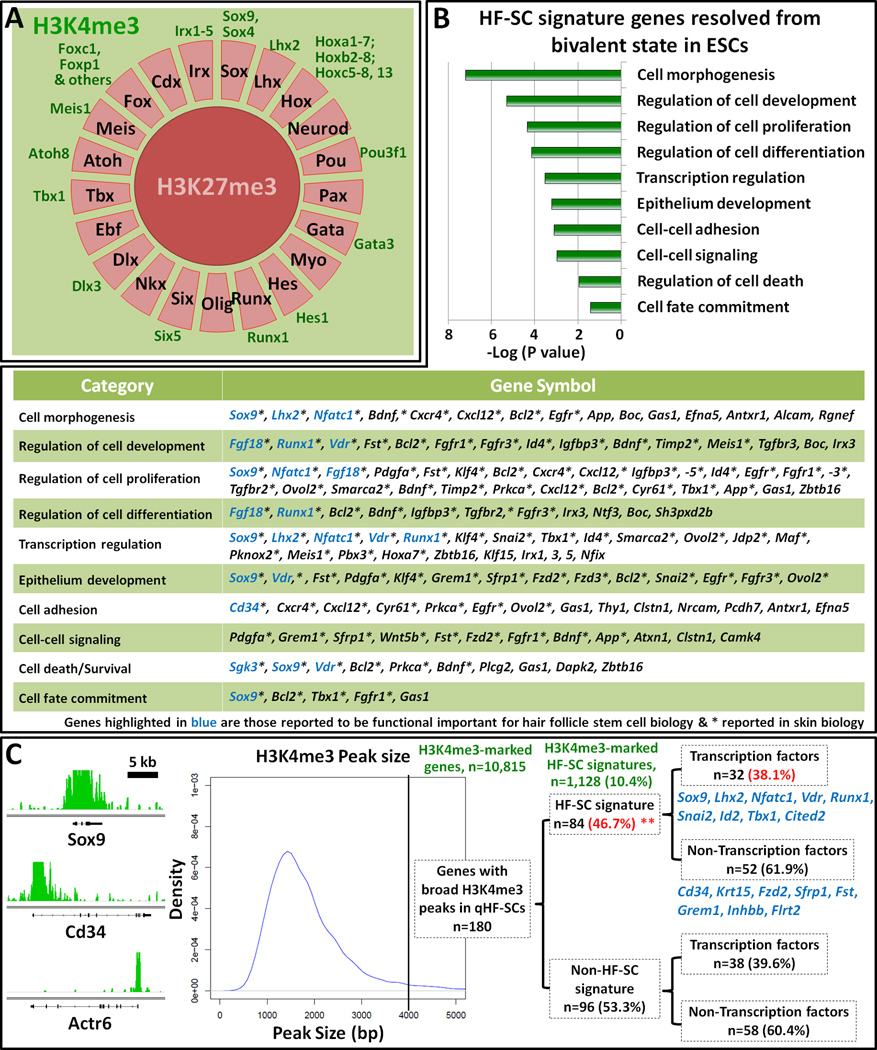
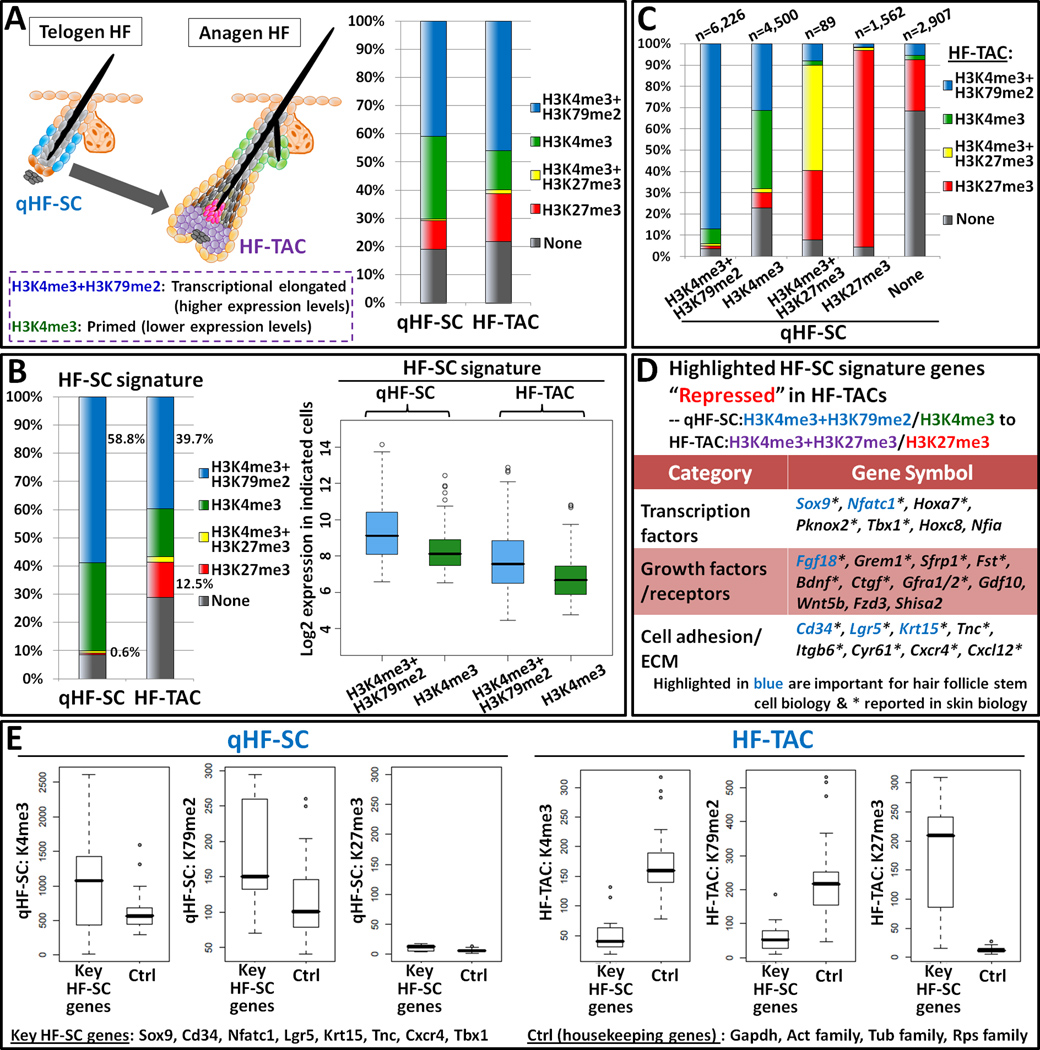
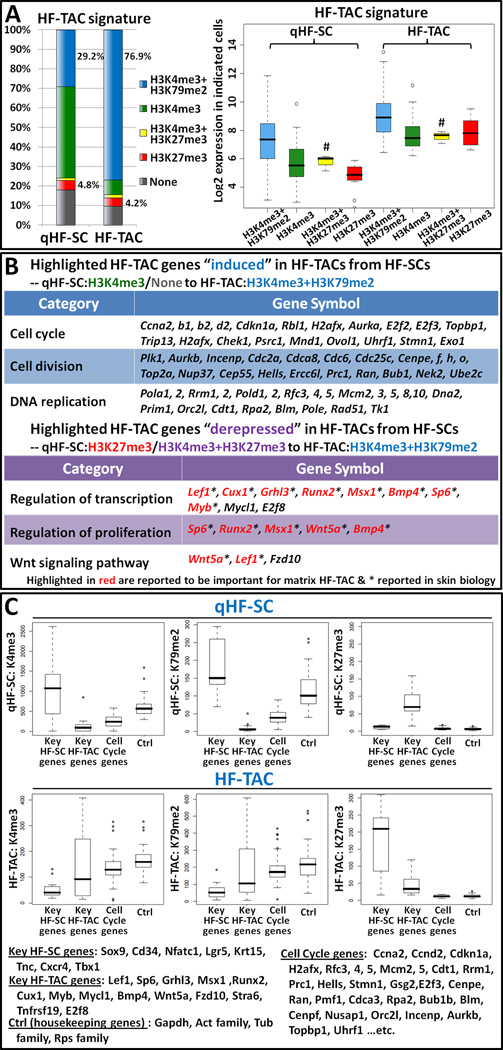
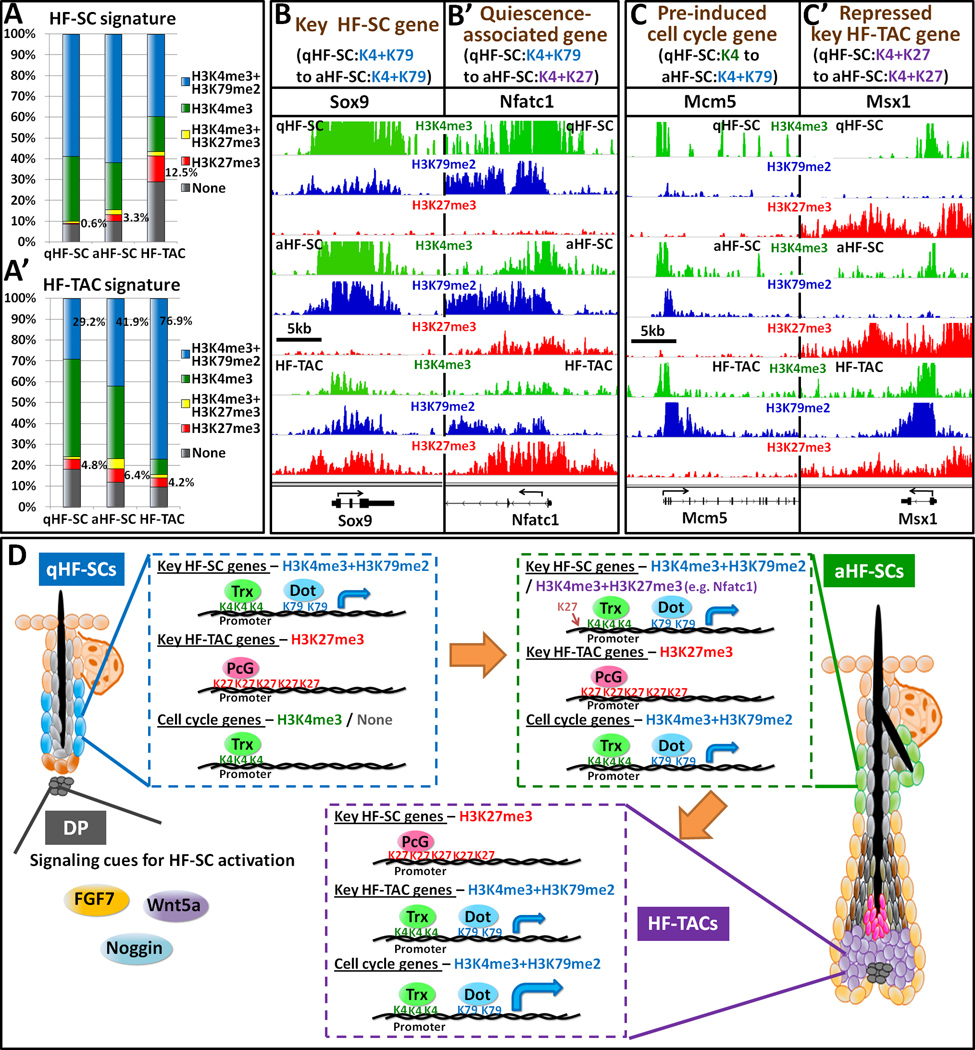
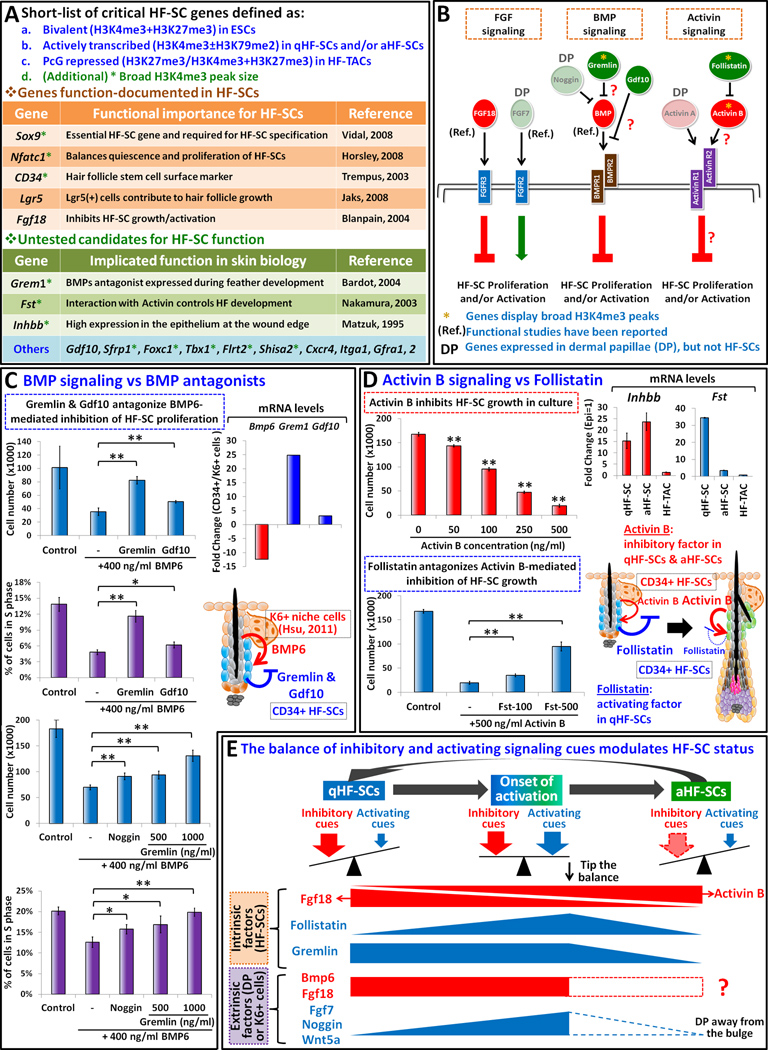
Using mouse skin, where bountiful reservoirs of synchronized hair follicle stem cells (HF-SCs) fuel cycles of regeneration, we explore how adult SCs remodel chromatin in response to activating cues. By profiling global mRNA and chromatin changes in quiescent and activated HF-SCs and their committed, transit-amplifying (TA) progeny, we show that polycomb-group (PcG)-mediated H3K27-trimethylation features prominently in HF-lineage progression by mechanisms distinct from embryonic-SCs. In HF-SCs, PcG represses nonskin lineages and HF differentiation. In TA progeny, nonskin regulators remain PcG-repressed, HF-SC regulators acquire H3K27me3-marks, and HF-lineage regulators lose them. Interestingly, genes poised in embryonic stem cells, active in HF-SCs, and PcG-repressed in TA progeny encode not only key transcription factors, but also signaling regulators. We document their importance in balancing HF-SC quiescence, underscoring the power of chromatin mapping in dissecting SC behavior. Our findings explain how HF-SCs cycle through quiescent and activated states without losing stemness and define roles for PcG-mediated repression in governing a fate switch irreversibly.


Figures

Figure 1
Figure 1. Molecular Signatures of mRNAs for Quiescent and Activated States of SCs and Their TA Progeny in Adult HFs
(A) Schematic of adult HF compartments and cell surface markers used for FACS. (B) Sequential FACS purifications of aHF-SCs and HF-TACs from anagen HFs. Purifications of qHF-SCs were as described (Blanpain et al., 2004). (C) Heatmap and clustering of mRNA expression profiles of signature genes. (D) Functional categories of gene ontology and representative examples of mRNAs upregulated ≥2X in a) quiescent, active or common HF-SCs relative to HF-TAC; and b) HF-TAC relative to HF-SCs. Signatures in (C, D) are color-coded according to cell populations in (A). See also Figure S1 & Table S1.
Figure 2
Figure 2. Genome-Wide Mapping of H3K4me3 and H3K27me3 Profiles in qHF-SCs
(A) Global in vivo H3K4me3 and H3K27me3 patterns in qHF-SC chromatin, compared with published in vitro data on chromatin from cultured murine ESCs, MEFs and NPCs (Mikkelson et al., 2007). In contrast to ESCs and MEFs, very few bivalent genes (yellow) were detected in qHF-SCs or NPCs. (B) Genes that in ESCs displayed one of four H3 methylation patterns (horizontal axis) and how this changes in qHF-SC chromatin. Each bar is normalized to 100% (n=number of ESC genes with each mark). Color-coding is for the qHF-SC genes and denotes the % of total genes within the ESC gene set that has either the same or a different mark in qHF-SCs. Green, H3K4me3; yellow, bivalent/dual marked with H3K4me3 and H3K27me3; red, H3K27me3; gray, neither mark. Note that most genes that were bivalent in ESCs are either H3K4me3 (primed/active) or H3K27me3 (repressed) in qHF-SCs. (C) Gene ontologies of bivalent ESC genes that display only H3K27me3 in qHF-SCs. Ontology terms are shown on the y axis; numbers of genes which fall into each category based upon functional studies are graphed along the x axis. (D) Except for Tcf3, ESC pluripotency genes are not transcribed in qHF-SCs. Shown are ChIP-seq signal tracks across indicated genes. Exon-intron structures and coding strand direction are depicted beneath. All tracks are set to the same scale (0–50); IGV browser. RT-PCR: pluripotency mRNAs from qHF-SCs and ESCs. Negative (-RT) and positive (Gapdh) controls. (E) Despite the silencing of pluripotency genes in qHF-SCs, ~80% of Sox2/Oct4/Nanog direct targets that are H3K4me3+ in ESCs (Boyer et al., 2006; Cole et al., 2008) are also H3K4me3+ in qHF-SCs. Examples of these genes are listed in the table. See also Table S2, S3.
Figure 3
Figure 3. Identifying Key HF Regulators from Aspects of Histone Modification
(A) Classifications of mouse transcription factor (TF) genes that are bivalent in ESCs and their chromatin status in qHF-SCs. Most genes within each superfamily are repressed (red) in qHF-SCs. Of the small number of these genes which are active (green), ~50% are known to be functionally important in HF-SCs. (B) Classifications and associated examples of lineage-specific HF-SC signature genes (H3K4me3+) that exist in a bivalent state in ESCs. Highlighted are genes previously implicated in skin biology in general (*) or HF-SCs in particular (blue). (C) Examples of HF-SC signature genes (Sox9, Cd34) displaying broad H3K4me3 peaks in qHF-SCs compared to a housekeeping gene (Actr6). Shown at right are peak size distributions of H3K4me3 intervals associated with all promoters marked by H3K4me3 in qHF-SCs. Of the 180 genes with broad (>4kb) peaks, 84 are in the HF-SC signature (46.7% vs 10.4%; **, p<0.001) (examples in blue). Note: TFs with broad H3K4me3 peaks are highly enriched in both non-signature and signatures. See also Table S4.
Figure 4
Figure 4. The Transition from HF-SCs to HF-TACs Involves PcG-Mediated Gene Repression of Key Stemness Genes
(A) Schematic of the two cell populations used for the comparisons described in this Figure. (Right) Global histone methylation patterns of chromatin from qHF-SCs and matrix HF-TACs. Note paucity of H3K4me3+H3K27me3 marked genes (yellow bar). (B) (Left) 12.5% of HF-SC signature genes are PcG-repressed in HF-TACs (red). (Right) mRNA expression (Log2) of HF-SC signature genes marked by H3K4me3+H3K79me2 is much greater in qHF-SCs than equivalently marked genes in HF-TACs. H3K4me3+H3K79me2 marked genes (blue) are more highly expressed than genes marked only by H3K4me3 (green). (C) How H3 methylation patterns of qHF-SC chromatin change during the transition to HF-TACs. Genes (total numbers indicated above each bar) displaying a particular chromatin state in qHF-SCs (indicated below each bar) were analyzed for their H3 methylation patterns in HF-TACs (color-coded as indicated). Note that only a small number of genes repressed or bivalent in qHF-SCs are now active in HF-TACs. Note also that some genes marked by H3K4me3 in qHF-SCs are now H3K27me3-repressed in HF-TACs. (D) Gene ontologies and associated examples of HF-SC signature genes that go from an active to repressed state in HF-TACs. Note that key HF-SC TF genes are among this shortlist. (E) Box and whisker plots of H3K4me3 and H3K79me2 peak intensities over key HF-SC genes vs housekeeping/control genes (examples provided beneath the plots) as analyzed both in qHF-SCs and in HF-TACs. Note that peak intensities are greatest for key genes in qHF-SCs, and that marked reductions in these chromatin marks occurs upon transition to the TA state. See also Figure S2 & Table S5.
Figure 5
Figure 5. Transitioning from HF-SCs to HF-TACs Involves PcG-Mediated Gene Derepression of Key HF-TAC Regulators
(A) Many HF-TAC signature genes show H3K4me3+ marks in qHF-SCs but H3K4me3+H3K79me2 marks in HF-TACs. At right are HF-TAC signature mRNA levels (Log2) of genes that display the indicated chromatin states in qHF-SCs vs HF-TACs. Note that HF-TAC signature mRNAs are always higher in HF-TACs vs HF-SCs, irrespective of which chromatin mark is compared. #, n=3. (B) In the HF-SC→HF-TAC switch, “induced” HF-TAC signature genes are largely cell cycle genes (blue), while “derepressed” HF-TAC signature genes are mostly known key matrix regulators (purple). Genes known to be important for skin biology (*) or for matrix HF-TAC function (red) are highlighted. (C) Box and whisker plots to show H3 modification peak intensities over signature genes for qHF-SCs (top) or HF-TACs (bottom) that fall into one of the four categories indicated (representative genes provided below the plots). Note that key matrix regulators display strong repressive peak intensities in qHF-SCs. This repression is then relieved in HF-TACs accompanied by increased intensities of H3K4me3 and H3K79me3 peaks. See also Table S6.
Figure 6
Figure 6. The Transition from Quiescent to Activated HF-SCs Maintains the Status of Many PcG-Regulated Genes While Activating Cell Cycle Genes Not Governed by PcG
(A-A’) Chromatin characteristics of HF-SC (A) and HF-TAC (A’) signature genes are similar for quiescent and activated HF-SCs but distinct from HF-TACs. (B-B’) Quiescent and activated HF-SC Chip-seq profiles of key regulators of HF-SC maintenance (B) and quiescence (B’). All tracks are set to the same scale. Note chromatin changes in SC quiescence but not maintenance genes. (C-C’) Cell cycle genes (e.g. Mcm5 in C), but not key matrix regulators (e.g. Msx1 in C’) are pre-induced in aHF-SCs. ChIP-seq profiles from quiescent and activated HF-SC and HF-TAC chromatin. (D) Working model for PcG-mediated regulation in governing an irreversible fate switch. In qHF-SCs, key HF-TAC genes are PcG-repressed whereas HF-SC genes are PcG-free and actively transcribed. Upon activation, HF-SCs maintain SC characteristics, while a few genes associated with quiescence (e.g. Fgf18, Nfatc1) become repressed by PcG. In response to activating cues, aHF-SCs pre-induce (+H3K79me2) cell cycle genes that are not targeted by PcG; this induction is later enhanced upon transition to HF-TACs. Notably, HF-TAC regulators remain PcG-repressed in aHF-SCs, and this repression is not relieved until the HF fate is determined in TACs. Along with this derepression, HF-SC genes are now silenced by PcG in TA progeny. See also Figures S3, S4, S5 & Table S7.
Figure 7
Figure 7. PcG-regulated Signaling Pathways Mediate the Balance of HF-SC quiescence and activation
(A) HF-SC genes which share the listed chromatin/expression criteria are enriched for functionally important genes in HF-SCs (orange) and/or skin (green). A number of these genes encode signaling pathway factors or TFs of undetermined function in the skin/HF-SCs (blue). * Denotes genes exhibiting broad H3K4me3 peaks in qHF-SCs. (B) HF-SC signaling pathways from (A) that are predicted to impact proliferation and/or activation in a cell-autonomous fashion based solely upon the chromatin and transcriptional characteristics of their receptors and ligands. Ligands and antagonists for HF-SC receptors are expressed in HF-SCs (bright color) or DP (dim color). Anticipated proliferative effects of factors on HF-SCs are stimulatory (green) or inhibitory (red). (C) (Left) Recombinant Gremlin and Gdf10 antagonize BMP6-mediated inhibition of HF-SC growth and proliferation in culture. HF-SCs were cultured for 5 days in the presence of 400 ng/ml BMP6 ± 1µg/ml Gremlin or Gdf10. Control: Cells treated with vehicle. S phase cells were detected by EdU-pulse labeling. Data are reported as average ± SD; **p<0.01; *p<0.05. (Right) Relative fold changes in Bmp6, Grem1, and Gdf10 mRNAs from CD34+ HF-SCs and K6+ niche cells (unpublished microarray data, Hsu and Fuchs). Working model shows how proteins encoded by increased HF-SC Gremlin and Gdf10 mRNA levels might antagonize BMP6-mediated inhibitory cues from K6+ niche cells (Hsu et al., 2011). (D) (Left) Recombinant Activin B and Follistatin exert opposing effects on HF-SC proliferation in vitro. HF-SCs were cultured with indicated amounts of Activin B (top), and in the presence of 500 ng/ml Activin B, cells were treated ± 100 (Fst-100) or 500 ng/ml (Fst-500) Follistatin (bottom). Data are reported as average ± SD; **p<0.01; *p<0.05. (Right) mRNA patterns of Activin B (Inhbb) and Follistatin (Fst). Model summarizes the results. (E) Model summarizing how the balance of intrinsic/extrinsic inhibitory and activating signaling cues modulates HF-SC status. Prior studies concentrated on the influence of inhibitory and activating cues from the SC microenvironment. The short-list of genes in (A) guided us to intrinsic regulators which we show contribute to this balancing act. See also Figures S6, S7.

Comment in

References

    1. Adli M, Zhu J, Bernstein BE. Genome-wide chromatin maps derived from limited numbers of hematopoietic progenitors. Nat Methods. 2010;7:615–618. - PMC - PubMed
    1. Bardot B, Lecoin L, Fliniaux I, Huillard E, Marx M, Viallet JP. Drm/Gremlin, a BMP antagonist, defines the interbud region during feather development. Int J Dev Biol. 2004;48:149–156. - PubMed
    1. Barski A, Cuddapah S, Cui K, Roh TY, Schones DE, Wang Z, Wei G, Chepelev I, Zhao K. High-resolution profiling of histone methylations in the human genome. Cell. 2007;129:823–837. - PubMed
    1. Bernstein BE, Mikkelsen TS, Xie X, Kamal M, Huebert DJ, Cuff J, Fry B, Meissner A, Wernig M, Plath K, Jaenisch R, Wagschal A, Feil R, Schreiber SL, Lander ES. A bivalent chromatin structure marks key developmental genes in embryonic stem cells. Cell. 2006;125(2):315–326. - PubMed
    1. Blanpain C, Fuchs E. Epidermal homeostasis: a balancing act of stem cells in the skin. Nat Rev Mol Cell Biol. 2009;10:207–217. - PMC - PubMed

Publication types

Associated data