

Nanoparticle-mediated gene transfer specific to retinal pigment epithelial cells
- PMID: 21885113
- PMCID: PMC3321842
- DOI: 10.1016/j.biomaterials.2011.08.062
Nanoparticle-mediated gene transfer specific to retinal pigment epithelial cells
Abstract
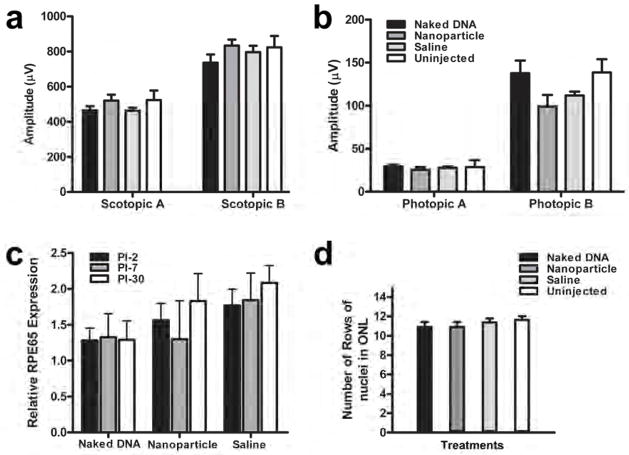
Previously, we demonstrated that CK30PEG10k-compacted DNA nanoparticles (NPs) efficiently target photoreceptor cells and improve visual function in a retinitis pigmentosa model. Here, we test the ability of these NPs in driving transgene expression in the retinal pigment epithelium (RPE), using an RPE-specific reporter vector (VMD2-eGFP). NPs, uncompacted plasmid, or saline were subretinally delivered to adult BALB/c mice. NP-based expression was specific to RPE cells and caused no deleterious effects on retinal structure and function. eGFP expression levels in NP-injected eyes peaked at post-injection day 2 (PI-2), stabilized at levels ~3-fold higher than in naked DNA-injected eyes, and remained elevated at the latest time-point examined (PI-30). Unlike naked DNA, which only transfected cells at the site of injection, NPs were able to transfect cells throughout the RPE. Subretinal injections of rhodamine labeled NPs and naked DNA showed comparable initial uptake into RPE cells. However, at PI-7 and -30 days significantly more fluorescence was detected inside the RPE of NP-injected eyes compared to naked DNA, suggesting NPs are stable inside the cell which could possibly lead to higher and sustained expression. Overall, our results demonstrate that NPs can efficiently deliver genes to the RPE and hold great potential for the treatment of RPE-associated diseases.
Published by Elsevier Ltd.
Figures


Similar articles
-
Direct gene transfer with compacted DNA nanoparticles in retinal pigment epithelial cells: expression, repeat delivery and lack of toxicity.Nanomedicine (Lond). 2012 Apr;7(4):521-39. doi: 10.2217/nnm.11.158. Epub 2012 Feb 23. Nanomedicine (Lond). 2012. PMID: 22356602 Free PMC article.
-
Persistence of non-viral vector mediated RPE65 expression: case for viability as a gene transfer therapy for RPE-based diseases.J Control Release. 2013 Dec 28;172(3):745-52. doi: 10.1016/j.jconrel.2013.08.299. Epub 2013 Sep 11. J Control Release. 2013. PMID: 24035979 Free PMC article.
-
Self-complementary AAV5 vector facilitates quicker transgene expression in photoreceptor and retinal pigment epithelial cells of normal mouse.Exp Eye Res. 2010 May;90(5):546-54. doi: 10.1016/j.exer.2010.01.011. Epub 2010 Feb 4. Exp Eye Res. 2010. PMID: 20138034 Free PMC article.
-
Synthesis and characterization of glycol chitosan DNA nanoparticles for retinal gene delivery.ChemMedChem. 2014 Jan;9(1):189-96. doi: 10.1002/cmdc.201300371. Epub 2013 Nov 7. ChemMedChem. 2014. PMID: 24203490 Free PMC article.
-
DNA nanoparticles are safe and nontoxic in non-human primate eyes.Int J Nanomedicine. 2018 Mar 8;13:1361-1379. doi: 10.2147/IJN.S157000. eCollection 2018. Int J Nanomedicine. 2018. PMID: 29563793 Free PMC article.
Cited by
-
Suprachoroidally Delivered DNA Nanoparticles Transfect Retina and Retinal Pigment Epithelium/Choroid in Rabbits.Transl Vis Sci Technol. 2020 Dec 15;9(13):21. doi: 10.1167/tvst.9.13.21. eCollection 2020 Dec. Transl Vis Sci Technol. 2020. PMID: 33364076 Free PMC article.
-
Comparative analysis of DNA nanoparticles and AAVs for ocular gene delivery.PLoS One. 2012;7(12):e52189. doi: 10.1371/journal.pone.0052189. Epub 2012 Dec 18. PLoS One. 2012. PMID: 23272225 Free PMC article.
-
Nanoparticle-assisted targeted delivery of eye-specific genes to eyes significantly improves the vision of blind mice in vivo.Nano Lett. 2014 Sep 10;14(9):5257-63. doi: 10.1021/nl502275s. Epub 2014 Aug 12. Nano Lett. 2014. PMID: 25115433 Free PMC article.
-
Stages, pathogenesis, clinical management and advancements in therapies of age-related macular degeneration.Int Ophthalmol. 2023 Oct;43(10):3891-3909. doi: 10.1007/s10792-023-02767-2. Epub 2023 Jun 22. Int Ophthalmol. 2023. PMID: 37347455 Review.
-
Novel Strategies for the Improvement of Stem Cells' Transplantation in Degenerative Retinal Diseases.Stem Cells Int. 2016;2016:1236721. doi: 10.1155/2016/1236721. Epub 2016 May 18. Stem Cells Int. 2016. PMID: 27293444 Free PMC article. Review.
References
-
- Hoffman EA, Conley SM, Stamer WD, McKay BS. Barriers to productive transfection of trabecular meshwork cells. Mol Vis. 2005;11:869–875. - PubMed
-
- Tros de Ilarduya C, Sun Y, Duzgunes N. Gene delivery by lipoplexes and polyplexes. Eur J Pharm Sci. 2010;40(3):159–170. - PubMed
-
- Zhang S, Zhao Y, Zhao B, Wang B. Hybrids of nonviral vectors for gene delivery. Bioconjug Chem. 2010;21(6):1003–1009. - PubMed
-
- Liu G, Li D, Pasumarthy MK, Kowalczyk TH, Gedeon CR, Hyatt SL, et al. Nanoparticles of compacted DNA transfect postmitotic cells. J Biol Chem. 2003;278(35):32578–32586. - PubMed
Publication types
MeSH terms
Substances
Grants and funding
LinkOut - more resources
Full Text Sources
Other Literature Sources
Research Materials
Miscellaneous
