

Diffusion tensor imaging tractography of the optic radiation for epilepsy surgical planning: a comparison of two methods
- PMID: 21885257
- PMCID: PMC3223565
- DOI: 10.1016/j.eplepsyres.2011.07.019
Diffusion tensor imaging tractography of the optic radiation for epilepsy surgical planning: a comparison of two methods
Abstract
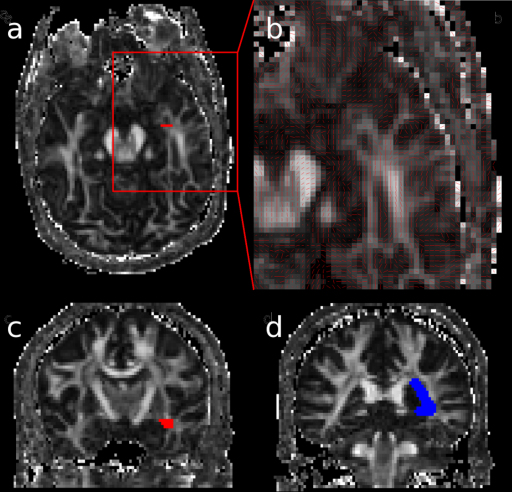
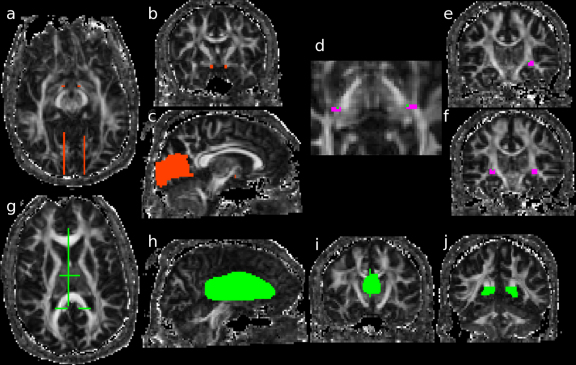
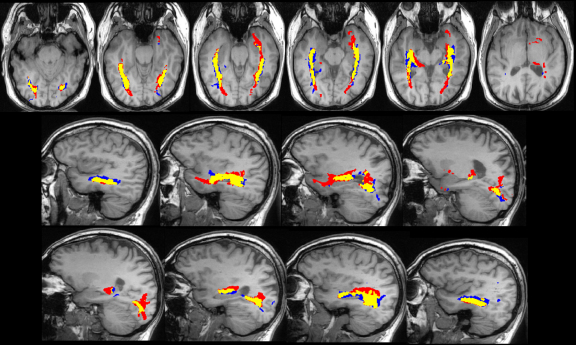
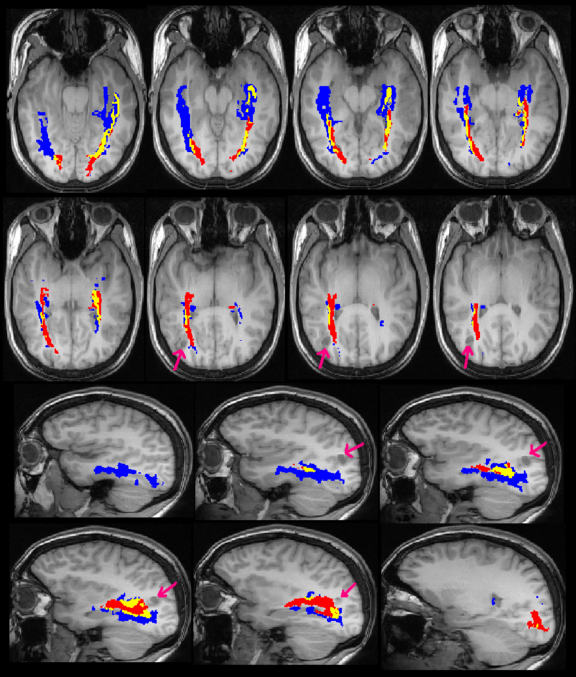
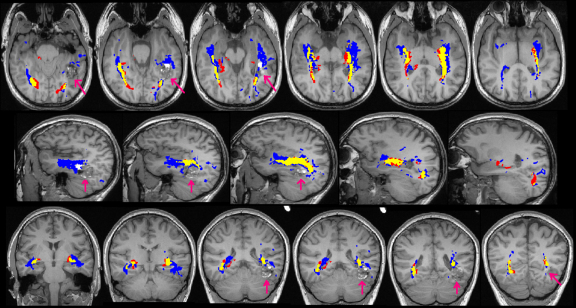
The optic radiation is a key white matter structure at risk during epilepsy surgery involving the temporal, parietal or occipital lobes. It shows considerable anatomical variability, cannot be delineated on clinical MRI sequences and damage may cause a disabling visual field deficit. Diffusion tensor imaging tractography allows non-invasive mapping of this pathway. Numerous methods have been published but direct comparison is difficult as patient, acquisition and analysis parameters differ. Two methods for delineating the optic radiation were applied to 6 healthy controls and 4 patients with epileptogenic lesions near the optic radiation. By comparing methods with the same datasets, many of the parameters could be controlled. The first method was previously developed to accurately identify Meyer's loop for planning anterior temporal lobe resection. The second aimed to address limitations of this method by using a more automated technique to reduce operator time and to depict the entire optic radiation. Whilst the core of the tract was common to both methods, there was significant variability between the methods. Method 1 gave a more consistent depiction of Meyer's loop with fewer spurious tracts. Method 2 gave a better depiction of the entire optic radiation, particularly in more posterior portions, but did not identify Meyer's loop in one patient. These results show that whilst tractography is a promising technique, there is significant variability depending on the method chosen even when the majority of parameters are fixed. Different methods may need to be chosen for surgical planning depending on the individual clinical situation.
Crown Copyright © 2011. Published by Elsevier B.V. All rights reserved.
Figures
Similar articles
-
Optic radiation tractography and vision in anterior temporal lobe resection.Ann Neurol. 2012 Mar;71(3):334-41. doi: 10.1002/ana.22619. Ann Neurol. 2012. PMID: 22451201 Free PMC article.
-
Defining Meyer's loop-temporal lobe resections, visual field deficits and diffusion tensor tractography.Brain. 2009 Jun;132(Pt 6):1656-68. doi: 10.1093/brain/awp114. Epub 2009 May 21. Brain. 2009. PMID: 19460796 Free PMC article.
-
Intersubject variability in the anterior extent of the optic radiation assessed by tractography.Epilepsy Res. 2007 Oct;77(1):11-6. doi: 10.1016/j.eplepsyres.2007.07.012. Epub 2007 Sep 11. Epilepsy Res. 2007. PMID: 17851037
-
Validation of an automated tractography method for the optic radiations as a biomarker of visual acuity in neurofibromatosis-associated optic pathway glioma.Exp Neurol. 2018 Jan;299(Pt B):308-316. doi: 10.1016/j.expneurol.2017.06.004. Epub 2017 Jun 3. Exp Neurol. 2018. PMID: 28587872 Review.
-
Presurgical MR Imaging in Epilepsy.Clin Neuroradiol. 2015 Oct;25 Suppl 2:151-5. doi: 10.1007/s00062-015-0387-x. Epub 2015 Apr 8. Clin Neuroradiol. 2015. PMID: 25850640 Review.
Cited by
-
Aneurysmal subarachnoid hemorrhage causes injury of the ascending reticular activating system: relation to consciousness.AJNR Am J Neuroradiol. 2015 Apr;36(4):667-71. doi: 10.3174/ajnr.A4203. Epub 2015 Jan 8. AJNR Am J Neuroradiol. 2015. PMID: 25572950 Free PMC article.
-
Fractional anisotropy of the optic radiations correlates with the visual field after epilepsy surgery.Neuroradiology. 2019 Dec;61(12):1425-1436. doi: 10.1007/s00234-019-02281-2. Epub 2019 Sep 7. Neuroradiology. 2019. PMID: 31494681
-
Implementation of clinical tractography for pre-surgical planning of space occupying lesions: An investigation of common acquisition and post-processing methods compared to dissection studies.PLoS One. 2020 Apr 14;15(4):e0231440. doi: 10.1371/journal.pone.0231440. eCollection 2020. PLoS One. 2020. PMID: 32287298 Free PMC article.
-
The ascending reticular activating system from pontine reticular formation to the thalamus in the human brain.Front Hum Neurosci. 2013 Jul 25;7:416. doi: 10.3389/fnhum.2013.00416. eCollection 2013. Front Hum Neurosci. 2013. PMID: 23898258 Free PMC article.
-
Diffusion tensor tractography in the presurgical assessment of cerebral gliomas.Neuroradiol J. 2014 Feb;27(1):75-84. doi: 10.15274/NRJ-2014-10008. Epub 2014 Feb 24. Neuroradiol J. 2014. PMID: 24571836 Free PMC article.
References
-
- Alexander D.C., Barker G.J., Arridge S.R. Detection and modeling of non-Gaussian apparent diffusion coefficient profiles in human brain data. Magn. Reson. Med. 2002;48:331–340. - PubMed
-
- Barton J.J., Hefter R., Chang B., Schomer D., Drislane F. The field defects of anterior temporal lobectomy: a quantitative reassessment of Meyer's loop. Brain. 2005;128:2123–2133. - PubMed
-
- Basser P.J. Inferring microstructural features and the physiological state of tissues from diffusion-weighted images. NMR Biomed. 1995;8:333–344. - PubMed
-
- Behrens T.E., Johansen-Berg H., Woolrich M.W., Smith S.M., Wheeler-Kingshott C.A., Boulby P.A., Barker G.J., Sillery E.L., Sheehan K., Ciccarelli O., Thompson A.J., Brady J.M., Matthews P.M. Non-invasive mapping of connections between human thalamus and cortex using diffusion imaging. Nat. Neurosci. 2003;6:750–757. - PubMed
-
- Catani M., Jones D.K., Donato R., Ffytche D.H. Occipito-temporal connections in the human brain. Brain. 2003;126:2093–2107. - PubMed
