A computational model to predict the effects of class I anti-arrhythmic drugs on ventricular rhythms
- PMID: 21885405
- PMCID: PMC3328405
- DOI: 10.1126/scitranslmed.3002588
A computational model to predict the effects of class I anti-arrhythmic drugs on ventricular rhythms
Abstract
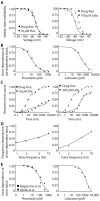
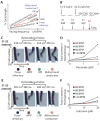
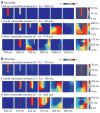
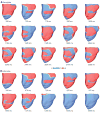
A long-sought, and thus far elusive, goal has been to develop drugs to manage diseases of excitability. One such disease that affects millions each year is cardiac arrhythmia, which occurs when electrical impulses in the heart become disordered, sometimes causing sudden death. Pharmacological management of cardiac arrhythmia has failed because it is not possible to predict how drugs that target cardiac ion channels, and have intrinsically complex dynamic interactions with ion channels, will alter the emergent electrical behavior generated in the heart. Here, we applied a computational model, which was informed and validated by experimental data, that defined key measurable parameters necessary to simulate the interaction kinetics of the anti-arrhythmic drugs flecainide and lidocaine with cardiac sodium channels. We then used the model to predict the effects of these drugs on normal human ventricular cellular and tissue electrical activity in the setting of a common arrhythmia trigger, spontaneous ventricular ectopy. The model forecasts the clinically relevant concentrations at which flecainide and lidocaine exacerbate, rather than ameliorate, arrhythmia. Experiments in rabbit hearts and simulations in human ventricles based on magnetic resonance images validated the model predictions. This computational framework initiates the first steps toward development of a virtual drug-screening system that models drug-channel interactions and predicts the effects of drugs on emergent electrical activity in the heart.
Figures


Similar articles
-
Predicting drug-induced slowing of conduction and pro-arrhythmia: identifying the 'bad' sodium current blockers.Br J Pharmacol. 2010 May;160(1):60-76. doi: 10.1111/j.1476-5381.2010.00646.x. Epub 2010 Mar 22. Br J Pharmacol. 2010. PMID: 20331615 Free PMC article.
-
Pharmacogenetics and anti-arrhythmic drug therapy: a theoretical investigation.Am J Physiol Heart Circ Physiol. 2007 Jan;292(1):H66-75. doi: 10.1152/ajpheart.00312.2006. Epub 2006 Sep 22. Am J Physiol Heart Circ Physiol. 2007. PMID: 16997895 Free PMC article.
-
Ischemic modulation of vulnerable period and the effects of pharmacological treatment of ischemia-induced arrhythmias: a simulation study.IEEE Trans Biomed Eng. 2003 Feb;50(2):168-77. doi: 10.1109/TBME.2002.807656. IEEE Trans Biomed Eng. 2003. PMID: 12665030
-
The management of ventricular dysrhythmia in aconite poisoning.Clin Toxicol (Phila). 2017 Jun;55(5):313-321. doi: 10.1080/15563650.2017.1291944. Epub 2017 Feb 20. Clin Toxicol (Phila). 2017. PMID: 28421842 Review.
-
Ranolazine in Cardiac Arrhythmia.Clin Cardiol. 2016 Mar;39(3):170-8. doi: 10.1002/clc.22476. Epub 2015 Oct 13. Clin Cardiol. 2016. PMID: 26459200 Free PMC article. Review.
Cited by
-
Image-based reconstruction of three-dimensional myocardial infarct geometry for patient-specific modeling of cardiac electrophysiology.Med Phys. 2015 Aug;42(8):4579-90. doi: 10.1118/1.4926428. Med Phys. 2015. PMID: 26233186 Free PMC article.
-
In silico investigation of the mechanisms underlying atrial fibrillation due to impaired Pitx2.PLoS Comput Biol. 2020 Feb 25;16(2):e1007678. doi: 10.1371/journal.pcbi.1007678. eCollection 2020 Feb. PLoS Comput Biol. 2020. PMID: 32097431 Free PMC article.
-
Longitudinal omics modeling and integration in clinical metabonomics research: challenges in childhood metabolic health research.Front Mol Biosci. 2015 Aug 5;2:44. doi: 10.3389/fmolb.2015.00044. eCollection 2015. Front Mol Biosci. 2015. PMID: 26301225 Free PMC article. Review.
-
Graft-host coupling changes can lead to engraftment arrhythmia: a computational study.J Physiol. 2023 Jul;601(13):2733-2749. doi: 10.1113/JP284244. Epub 2023 Apr 25. J Physiol. 2023. PMID: 37014103 Free PMC article.
-
Pathophysiology of the cardiac late Na current and its potential as a drug target.J Mol Cell Cardiol. 2012 Mar;52(3):608-19. doi: 10.1016/j.yjmcc.2011.12.003. Epub 2011 Dec 16. J Mol Cell Cardiol. 2012. PMID: 22198344 Free PMC article. Review.
References
-
- Rosen MR, Hoffman BF. Mechanisms of action of antiarrhythmic drugs. Circ Res. 1973;32:1–8. - PubMed
-
- Preliminary report: Effect of encainide and flecainide on mortality in a randomized trial of arrhythmia suppression after myocardial infarction. The Cardiac Arrhythmia Suppression Trial (CAST) Investigators. N Engl J Med. 1989;321:406–412. - PubMed
-
- Echt DS, Liebson PR, Mitchell LB, Peters RW, Obias-Manno D, Barker AH, Arensberg D, Baker A, Friedman L, Greene HL, Huther ML, Richardson DW, Investigators CAST. Mortality and morbidity in patients receiving encainide, flecainide, or placebo. The Cardiac Arrhythmia Suppression Trial. N Engl J Med. 1991;324:781–788. - PubMed
Publication types
MeSH terms
Substances
Grants and funding
- R01 HL085592/HL/NHLBI NIH HHS/United States
- P30: HL101280-01/HL/NHLBI NIH HHS/United States
- R01-HL-56810-16/HL/NHLBI NIH HHS/United States
- R01 HL082729/HL/NHLBI NIH HHS/United States
- R01 HL056810/HL/NHLBI NIH HHS/United States
- R01 HL103428/HL/NHLBI NIH HHS/United States
- 5 T 32 GM 07739/GM/NIGMS NIH HHS/United States
- T32 GM007739/GM/NIGMS NIH HHS/United States
- R01-HL-103428/HL/NHLBI NIH HHS/United States
- R01-HL-085592-S2/HL/NHLBI NIH HHS/United States
- R01-HL-085592-05/HL/NHLBI NIH HHS/United States
- R01-HL-082729/HL/NHLBI NIH HHS/United States
- P30 HL101280/HL/NHLBI NIH HHS/United States
LinkOut - more resources
Full Text Sources
Other Literature Sources
Medical

