. 2011 Aug 31;3(98):98ra84.
doi: 10.1126/scitranslmed.3002152.

Noninvasive electroanatomic mapping of human ventricular arrhythmias with electrocardiographic imaging

Affiliations

Noninvasive electroanatomic mapping of human ventricular arrhythmias with electrocardiographic imaging

Yong Wang et al. Sci Transl Med. .

Abstract

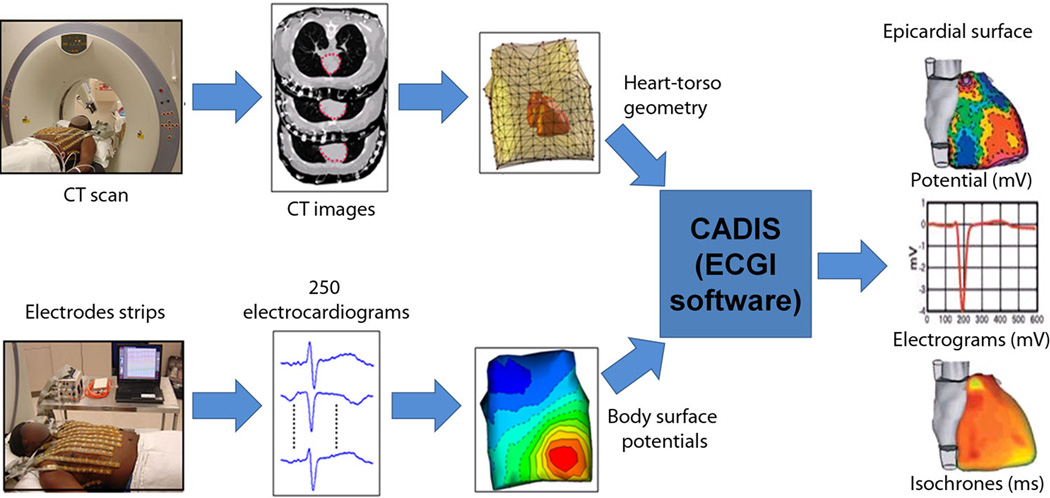
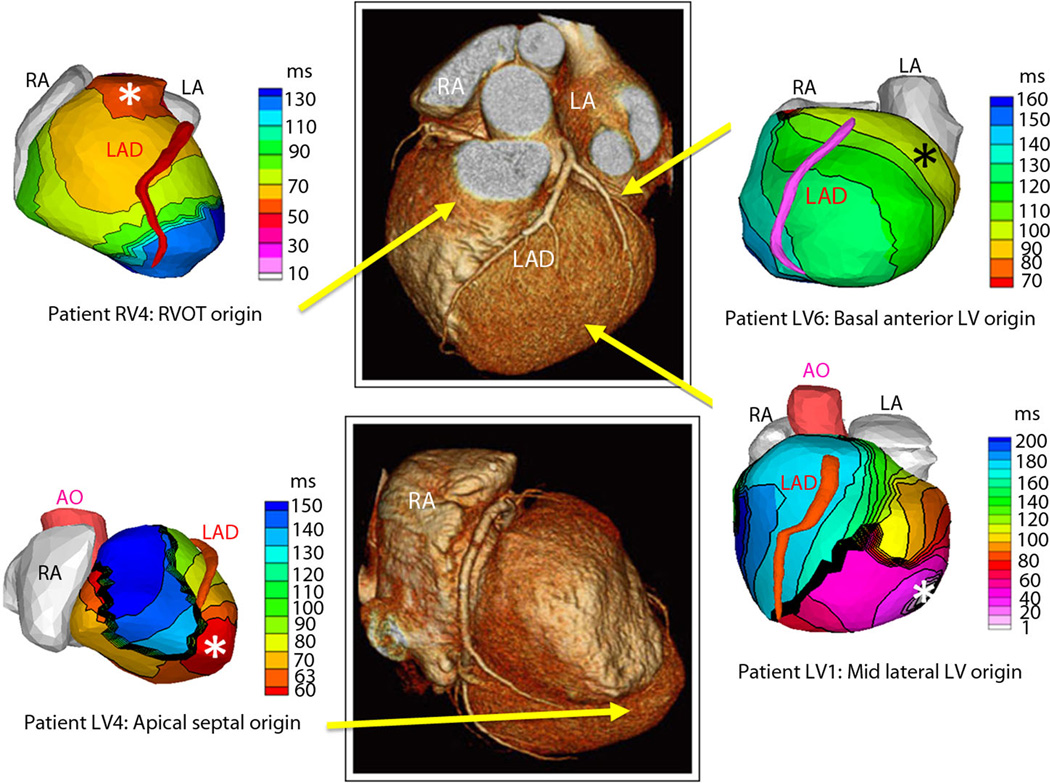
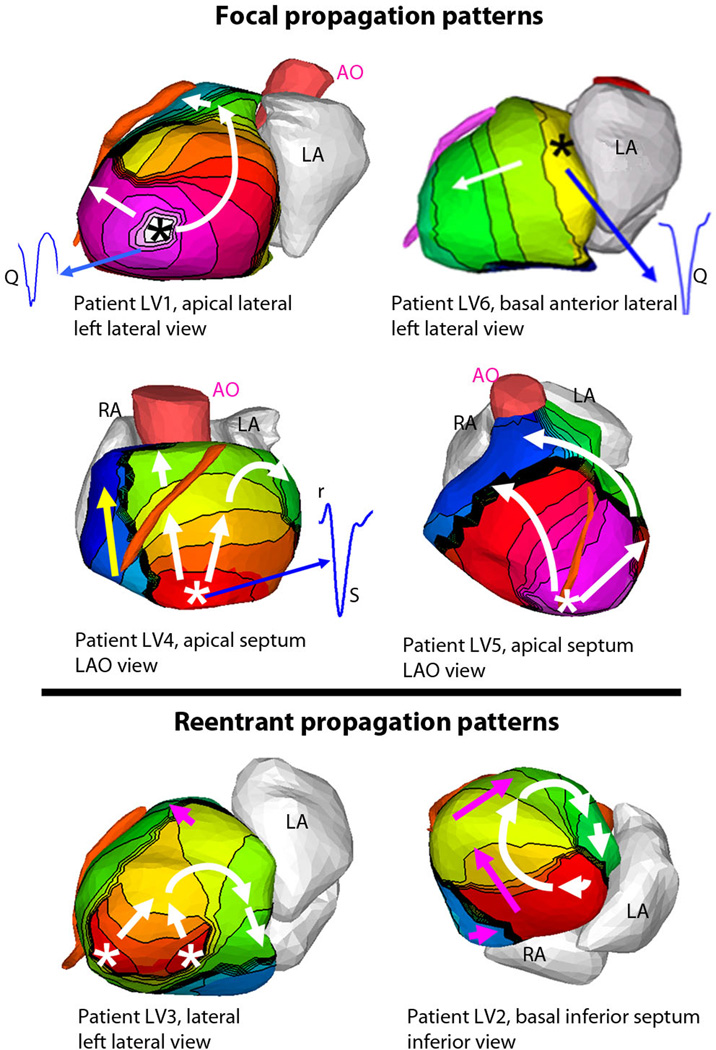
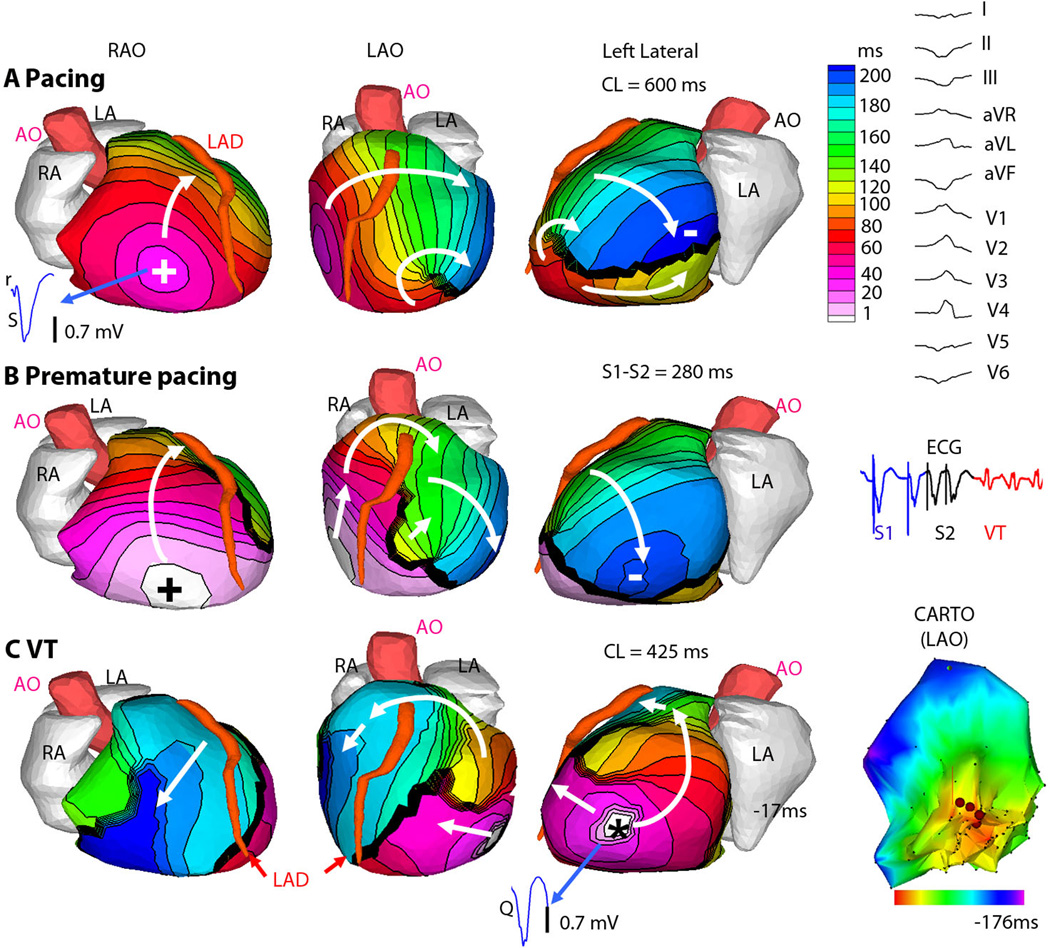
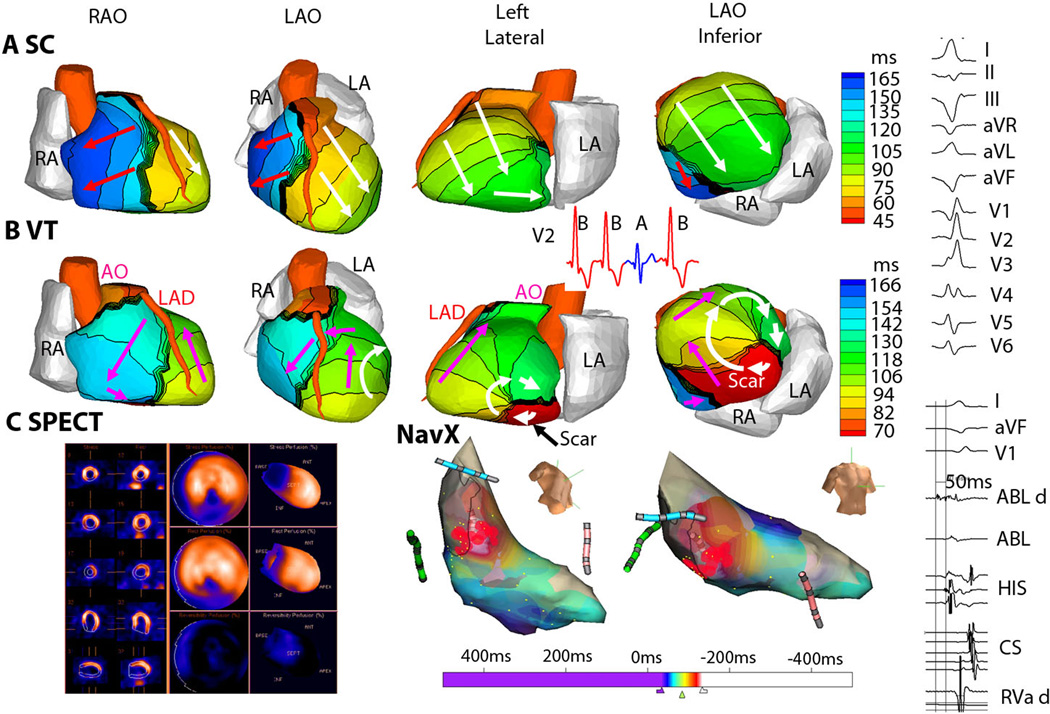
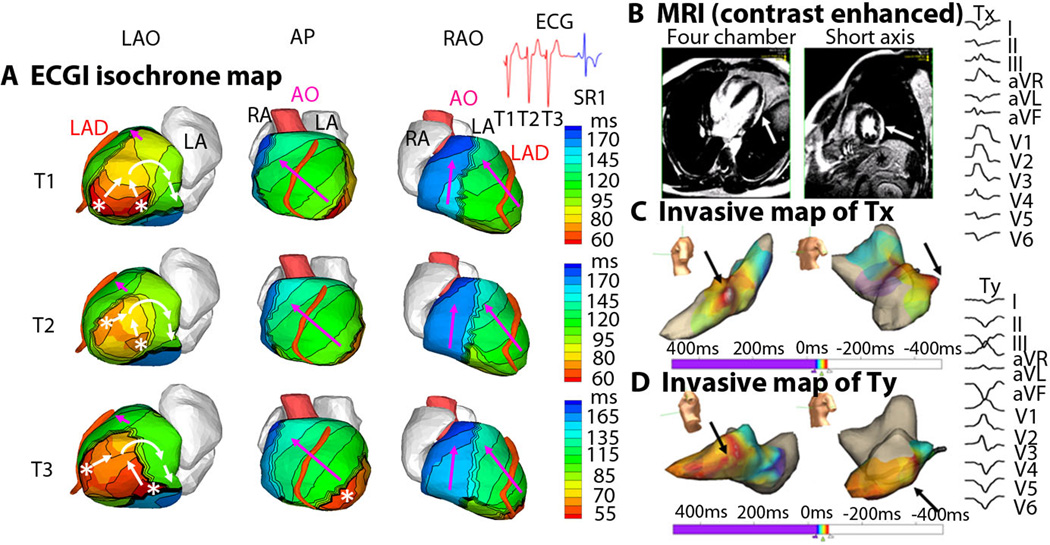
The rapid heartbeat of ventricular tachycardia (VT) can lead to sudden cardiac death and is a major health issue worldwide. Efforts to identify patients at risk, determine mechanisms of VT, and effectively prevent and treat VT through a mechanism-based approach would all be facilitated by continuous, noninvasive imaging of the arrhythmia over the entire heart. Here, we present noninvasive real-time images of human ventricular arrhythmias using electrocardiographic imaging (ECGI). Our results reveal diverse activation patterns, mechanisms, and sites of initiation of human VT. The spatial resolution of ECGI is superior to that of the routinely used 12-lead electrocardiogram, which provides only global information, and ECGI has distinct advantages over the currently used method of mapping with invasive catheter-applied electrodes. The spatial resolution of this method and its ability to image electrical activation sequences over the entire ventricular surfaces in a single heartbeat allowed us to determine VT initiation sites and continuation pathways, as well as VT relationships to ventricular substrates, including anatomical scars and abnormal electrophysiological substrate. Thus, ECGI can map the VT activation sequence and identify the location and depth of VT origin in individual patients, allowing personalized treatment of patients with ventricular arrhythmias.


Figures

Figure 1
Figure 1. ECGI methodology
250 carbon electrodes mounted in strips are applied to the patient's torso before a pre-procedural thoracic CT scan, which provides cardiac geometry and torso-electrode positions in the same reference frame. The electrodes are connected to a multi-channel mapping system. The electrical and anatomical data are processed mathematically to obtain noninvasive ECGI epicardial images that include potential maps, electrograms, isochronal activation sequences, and repolarization patterns. An ECGI movie of normal epicardial activation is provided in the Supplemental Material as reference (control) for the VT data (MOVIE N1).
Figure 2
Figure 2. Examples of noninvasive ECGI isochrone maps for localization of VT site of origin
Epicardial isochrone maps are shown for four patients, with earliest epicardial activation marked with an asterisk (see Supplemental Material for detailed description of activation sequences). EP-study-determined sites of origin are indicated under the ECGI maps. Yellow arrows point to VT origin on a representative CT scan. RA: right atrium; LA: left atrium; AO: aorta; LAD: left anterior descending coronary artery; LV: left ventricle; RVOT: right ventricular outflow tract.
Figure 3
Figure 3. ECGI imaged propagation patterns, origins, and local electrograms for VT
Isochrone maps are shown for six patients, with earliest epicardial activation marked with an asterisk (see Supplemental Material for detailed descriptions of activation sequences). (Top): Tachycardias that were determined to be focal during EP studies demonstrate a radial spread (white arrows) away from the early activation point (asterisk). Yellow arrows indicate later phases of ventricular activation. (Bottom): Tachycardias that were determined to be reentrant during EP studies show a rotational activation pattern (white arrows). Thick black lines indicate conduction block. Pink arrows indicate later phases of ventricular activation. (Insets): Several epicardial electrograms from sites of earliest activation are shown in blue, highlighting the presence or absence of r-wave; pure Q morphology indicates epicardial origin, rS morphology indicates intramural origin. Legend under each image indicates the location of VT initiation and identifies the displayed view of the heart; LAO = left anterior oblique.
Figure 4
Figure 4. ECGI of focal VT induced by programmed electrical stimulation (patient LV1)
(A) Epicardial activation sequence during drive train (S1) pacing at cycle length of 600ms. (RAO, right anterior oblique, LAO, left anterior oblique). White arrows show direction of wavefront propagation. Thick black line indicates conduction block. Earliest epicardial activation site is marked by + and corresponds to the underlying endocardial pacing site. ECGI epicardial electrogram from this site is shown (blue), with rS complex consistent with endocardial activation. (Right) The 12-lead surface ECG during VT. (B) Premature (S2) pacing at 280ms coupling interval from the same pacing site. The major wave front is forced to pivot around the extended line of block. There is some fusion with an intramural transseptal front (small white arrow). (Right) A single lead ECG is shown. All S1 beats (blue) are similar, as are the two S2 beats (black) and all VT beats (red) (C) VT; earliest epicardial activation site is marked by asterisk. ECGI electrogram from the VT origin site is shown (blue), with a pure Q wave, indicative of epicardial origin. (Right) Invasive LV endocardial activation map (CARTO) of the VT in LAO projection, (red is early). ECGI epicardial activation movies are in the Supplemental Material (Movie LV1).
Figure 5
Figure 5. ECGI of reentrant VT from inferobasal scar (patient LV2)
(A) Four views of activation sequence during a sinus capture (SC) beat (labeled A, blue on the V2 ECG). Arrows indicate direction of the activation wavefronts. (B) Activation sequence during VT beats (labeled B, red on the V2 ECG). White arrows indicate a clockwise lateral loop (left lateral and LAO inferior views); Pink arrows show propagation into the RV in a counter-clockwise fashion. (C) (Left) SPECT images showing a scar at the inferobasal LV region (blue). (Right) Limited invasive endocardial map of VT activation (red early, blue late). ECGI epicardial activation movies, including early activation of a region near the inferior scar border, are in Supplemental Material (Movie LV2). (Right Column) The 12-lead surface ECG during VT and the ablation-catheter signals. The earliest electrogram signal is seen at the inferoseptal borderzone, 50 ms before onset of the surface QRS.
Figure 6
Figure 6. ECGI of reentrant VT in lateral wall infiltrative cardiomyopathy (patient LV3)
(A) Activation patterns for three consecutive VT beats (T1, T2, T3). ECGI identified two distinct areas of early epicardial activation (white asterisks), which differed from beat to beat. The propagation pattern varied somewhat based on the relative contribution of the two sources, but for all beats the wavefront turns clockwise and propagates to the LV lateral base with a high degree of curvature, where it reaches a line of block in the inferolateral base. ECGI epicardial activation movie is available in the Supplemental Material. (B) A gadolinium-enhanced MRI revealed a patch of myocardial enhancement in the lateral LV (white arrows), consistent with a focal myocarditis or cardiac sarcoid. (C) The invasive electroanatomic map created during the presenting VT (arbitrarily named Tx). The region of earliest activation is white (black arrows). (D) The invasive electroanatomic map created during a different VT (arbitrarily named Ty) after the initial ablation at the site of earliest activation. The earliest activation (black arrows) is shifted more apically. (Right) 12-lead surface ECGs of two VT morphologies (Tx and Ty). AP = anterior-posterior view; SR1 = first sinus rhythm beat after VT.

Comment in

  • Imaging cardiac arrhythmias.
    Shivkumar K, Narayan SM. Shivkumar K, et al. Sci Transl Med. 2011 Aug 31;3(98):98fs2. doi: 10.1126/scitranslmed.3002806. Sci Transl Med. 2011. PMID: 21885402 Free PMC article.

References

    1. Moss AJ, Hall WJ, Cannom DS, Daubert JP, Higgins SL, Klein H, Levine JH, Saksena S, Waldo AL, Wilber D. Improved survival with an implanted defibrillator in patients with coronary disease at high risk for ventricular arrhythmia. Multicenter Automatic Defibrillator Implantation Trial Investigators. N. Engl. J. Med. 1996;335:1933–1940. - PubMed
    1. A comparison of antiarrhythmic-drug therapy with implantable defibrillators in patients resuscitated from near-fatal ventricular arrhythmias. The Antiarrhythmics versus Implantable Defibrillators (AVID) Investigators. N. Engl. J. Med. 1997;337:1576–1583. - PubMed
    1. Buxton AE, Lee KL, Fisher JD, Josephson ME, Prystowsky EN, Hafley G. A randomized study of the prevention of sudden death in patients with coronary artery disease. Multicenter Unsustained Tachycardia Trial Investigators. N. Engl. J. Med. 1999;341:1882–1890. - PubMed
    1. Wittig JH, Boineau JP. Surgical treatment of ventricular arrhythmia using epicardial, transmural, and endocardial mapping. Ann Thrac Surg. 1975;20:117–126. - PubMed
    1. Guiraudon G, Fontaine G, Frank R, Escande G, Etievent P, Cabrol C. Encircling endocardial ventriculotomy: a new surgical treatment for life-threatening ventricular tachycardias resistant to medical treatment following myocardial infarction. Ann Thorac Surg. 1978;26:438–444. - PubMed

Publication types

LinkOut - more resources