. 2011 Nov;52(11):2032-42.
doi: 10.1194/jlr.M019117. Epub 2011 Aug 31.

Adipose-selective overexpression of ABHD5/CGI-58 does not increase lipolysis or protect against diet-induced obesity

Affiliations

Adipose-selective overexpression of ABHD5/CGI-58 does not increase lipolysis or protect against diet-induced obesity

Jorge M Caviglia et al. J Lipid Res. 2011 Nov.

Abstract

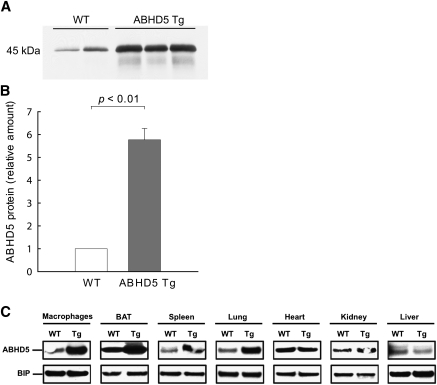
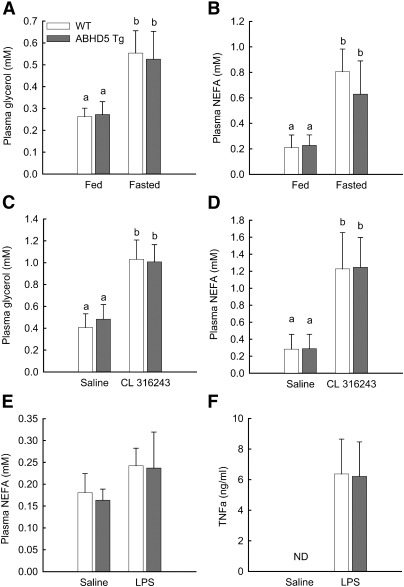
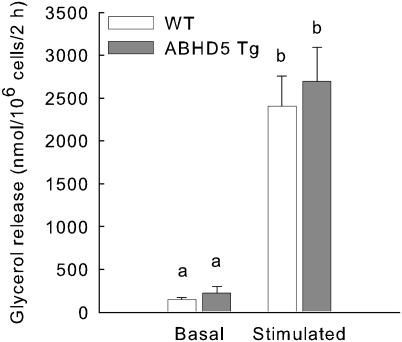
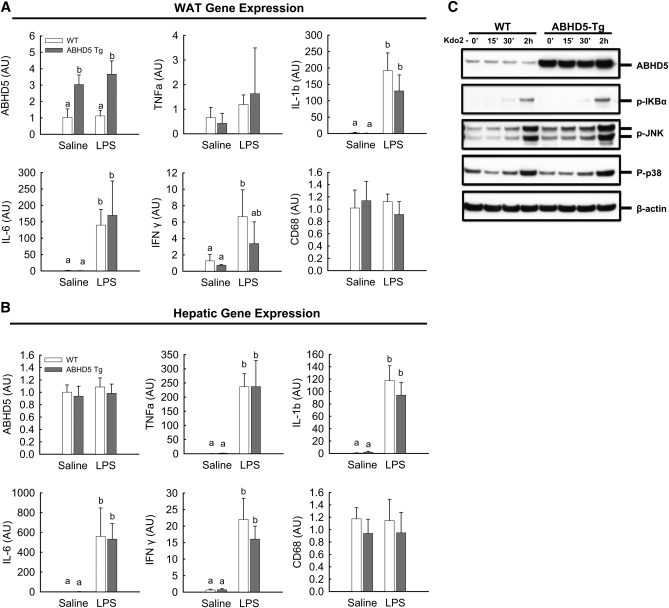
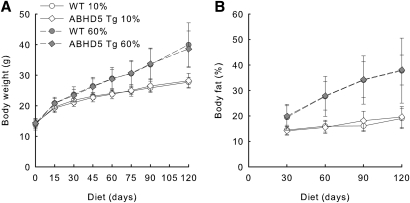
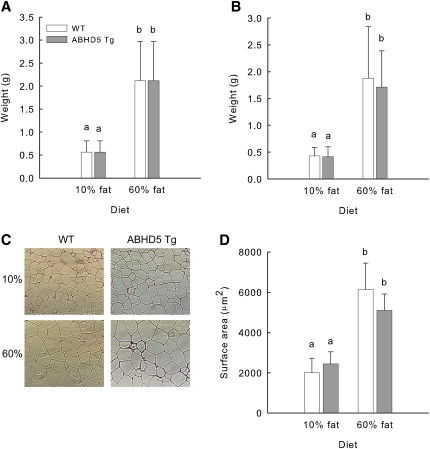
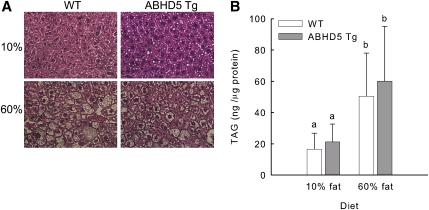
Adipose triglyceride lipase (ATGL) catalyzes the first step of triacylglycerol hydrolysis in adipocytes. Abhydrolase domain 5 (ABHD5) increases ATGL activity by an unknown mechanism. Prior studies have suggested that the expression of ABHD5 is limiting for lipolysis in adipocytes, as addition of recombinant ABHD5 increases in vitro TAG hydrolase activity of adipocyte lysates. To test this hypothesis in vivo, we generated transgenic mice that express 6-fold higher ABHD5 in adipose tissue relative to wild-type (WT) mice. In vivo lipolysis increased to a similar extent in ABHD5 transgenic and WT mice following an overnight fast or injection of either a β-adrenergic receptor agonist or lipopolysaccharide. Similarly, basal and β-adrenergic-stimulated lipolysis was comparable in adipocytes isolated from ABHD5 transgenic and WT mice. Although ABHD5 expression was elevated in thioglycolate-elicited macrophages from ABHD5 transgenic mice, Toll-like receptor 4 (TLR4) signaling was comparable in macrophages isolated from ABHD5 transgenic and WT mice. Overexpression of ABHD5 did not prevent the development of obesity in mice fed a high-fat diet, as shown by comparison of body weight, body fat percentage, and adipocyte hypertrophy of ABHD5 transgenic to WT mice. The expression of ABHD5 in mouse adipose tissue is not limiting for either basal or stimulated lipolysis.


Figures

Fig. 1.
Fig. 1.
Protein levels of ABHD5 are increased in adipose tissue and macrophages of ABHD5 Tg mice. (A) Protein levels of ABHD5 in white adipose tissue from perigonadal fat pads of wild-type (WT) and ABHD5 Tg mice were analyzed by immunoblotting; equal amounts of total protein were loaded in each lane. Results from a representative experiment are shown. (B) Levels of ABHD5 protein were quantified by densitometry and expressed relative to the level of ABHD5 present in WT mice. Values represent the means ± SEM from three independent experiments, each with 2-4 mice per genotype. Statistical analysis was performed using a one-sample t-test. (C) Protein levels of ABHD5 in tissues and cells of wild-type (WT) and ABHD5 Tg mice. For macrophage protein, freshly isolated thioglycolate-elicited macrophages were pooled from n = 5 mice per genotype and cultured as described in “Materials and Methods.” For tissue distribution, protein was pooled from n = 3 mice per genotype. Samples were probed on the same blotting membrane and binding immunoglobulin protein (BIP) was used as an invariant loading control.
Fig. 2.
Fig. 2.
Overexpression of ABHD5 does not alter in vivo lipolysis. (A, B) WT and ABHD5 Tg mice either were allowed free access to food or fasted for 24 h. Blood was collected, and the concentrations of glycerol (A) and NEFA (B) in plasma were measured. Values represent means ± SD (n = 9-10). (C, D) WT and ABHD5 Tg mice were injected with saline solution or the β3-adrenergic receptor agonist CL316243. Blood was collected 15 min later, and the concentrations of glycerol (C) and NEFA (D) in plasma were measured. Values represent means ± SD (n = 7-11). (E, F) WT and ABHD5 Tg mice were maintained on a standard chow diet and received a single intraperitoneal injection of either saline or LPS (5 μg per mouse). Blood was collected 1 h later, and plasma concentrations of NEFA (E) and TNFα (F) were determined. Values represent means ± SEM (n = 4-5). For all panels, statistical analyses were performed using two-way ANOVA and Bonferroni posthoc test; values not sharing a common superscript differ significantly (P < 0.05). ND, levels below the limit of detection.
Fig. 3.
Fig. 3.
Basal and isoproterenol-stimulated lipolysis are similar in adipocytes isolated from WT and ABHD5 Tg mice. Adipocytes were isolated from WT and ABHD5 Tg mice and incubated for two h without (basal) or with isoproterenol (stimulated) prior to measurement of glycerol released into the media. The values represent means ± SEM from four independent experiments, each with triplicate samples. Statistical analysis was performed using one-way ANOVA and Bonferroni posthoc test. Values not sharing a common superscript differ significantly (P < 0.001).
Fig. 4.
Fig. 4.
Transgenic overexpression of ABHD5 did not alter the systemic response to bacterial endotoxin. WT and ABHD5 Tg mice were maintained on a standard chow diet and received a single intraperitoneal injection of either saline or LPS (5 μg per mouse) 1 h prior to dissection of tissues. (A, B) Q-PCR analyses of epididymal white adipose tissue (WAT) (A) and hepatic (B) gene expression. TNFα, tumor necrosis factor α; IL-6, interleukin 6; IL-1β, interleukin 1β; IFNγ, interferon γ. Data in panels (A) and (B) represent the mean ± SD (n = 4); values not sharing a common superscript differ significantly (P < 0.05). (C) Freshly isolated thioglycolate-elicited macrophages were pooled from n = 5 mice per genotype and cultured as described in “Materials and Methods.” To examine TLR4-driven signal transduction, macrophages were treated with 10 ng/ml Kdo2-Lipid A (TLR4 agonist) for 2 h. Cell samples were collected at 15 and 30 min (15′, 30′) and 2 h (2h), and signaling was examined by immunoblotting to detect phospho-IκBα (Ser32), phospho-SAPK/JNK (Thr183/Tyr185), phospho-p38-MAPK (Thr180/Tyr182), and β-actin as a loading control.
Fig. 5.
Fig. 5.
Body weight and fat mass were similar in WT and ABHD5 Tg mice fed diets containing either 10% or 60% fat. Starting at the age of 4 weeks, WT and ABHD5 Tg mice were fed diets of defined composition containing either 10% or 60% of calories from fat for 120 days. The body weight (A) and percentage of fat mass (B) were determined at regular intervals. Values represent means ± SD (n = 15-19). Statistical analyses were performed using two-way ANOVA and Bonferroni posthoc test. Mice fed the 60% fat diet had greater weight and percentage of fat mass than mice fed the 10% fat diet at 15 days and later times (P < 0.001). No significant differences were observed when comparing ABHD5 Tg to WT mice fed either diet.
Fig. 6.
Fig. 6.
Fat pad weight and average adipocyte size were similar in WT and ABHD5 Tg mice fed diets containing either 10% or 60% fat. WT and ABHD5 Tg mice were fed defined diets containing either 10% or 60% of calories from fat. At 120 days, perigonadal (A) and subcutaneous (B) fat pads were dissected and weighed. Histological preparations were made from perigonadal fat pads (C) and used to determine the average sizes of adipocytes (D). Values represent means ± SD (n = 6-10). Statistical analyses were performed using one-way ANOVA and Bonferroni posthoc test. Values not sharing a common superscript differ significantly (P < 0.05).
Fig. 7.
Fig. 7.
Liver lipid infiltration and TAG content were similar in WT and ABHD5 Tg mice fed diets containing either 10% or 60% fat. WT and ABHD5 Tg mice were fed defined diets containing either 10% or 60% of calories from fat for 120 days. (A) Histological sections of liver were prepared, (B) lipids were extracted from liver samples, and the content of TAG was determined. Values represent means ± SD (n = 13-18). Statistical analyses were performed using one-way ANOVA and Bonferroni posthoc test. Values not sharing a common superscript differ significantly (P < 0.05).

Similar articles

Cited by

References

    1. Duncan R. E., Ahmadian M., Jaworski K., Sarkadi-Nagy E., Sul H. S. 2007. Regulation of lipolysis in adipocytes. Annu. Rev. Nutr. 27: 79–101 - PMC - PubMed
    1. Langin D. 2006. Control of fatty acid and glycerol release in adipose tissue lipolysis. C. R. Biol. 329: 598–607 - PubMed
    1. Schweiger M., Schreiber R., Haemmerle G., Lass A., Fledelius C., Jacobsen P., Tornqvist H., Zechner R., Zimmermann R. 2006. Adipose triglyceride lipase and hormone-sensitive lipase are the major enzymes in adipose tissue triacylglycerol catabolism. J. Biol. Chem. 281: 40236–40241 - PubMed
    1. Zechner R., Strauss J. G., Haemmerle G., Lass A., Zimmermann R. 2005. Lipolysis: pathway under construction. Curr. Opin. Lipidol. 16: 333–340 - PubMed
    1. Zimmermann R., Strauss J. G., Haemmerle G., Schoiswohl G., Birner-Gruenberger R., Riederer M., Lass A., Neuberger G., Eisenhaber F., Hermetter A., et al. 2004. Fat mobilization in adipose tissue is promoted by adipose triglyceride lipase. Science. 306: 1383–1386 - PubMed

Publication types

Substances