. 2011 Dec;25(12):4358-68.
doi: 10.1096/fj.11-190587. Epub 2011 Sep 1.

AMP-activated protein kinase enhances the phagocytic ability of macrophages and neutrophils

Affiliations

AMP-activated protein kinase enhances the phagocytic ability of macrophages and neutrophils

Hong-Beom Bae et al. FASEB J. 2011 Dec.

Abstract

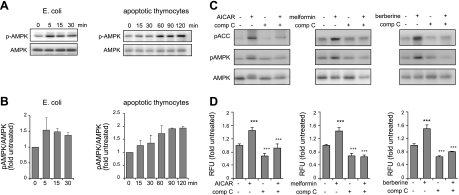
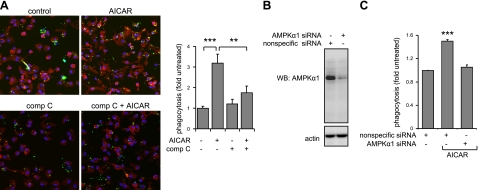
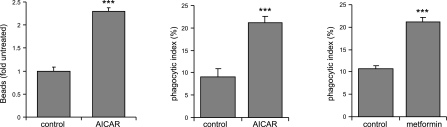
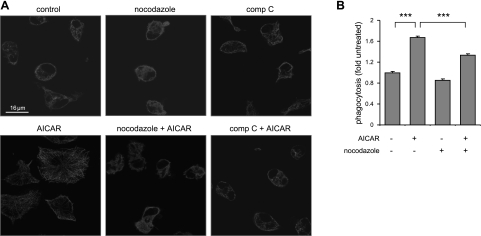
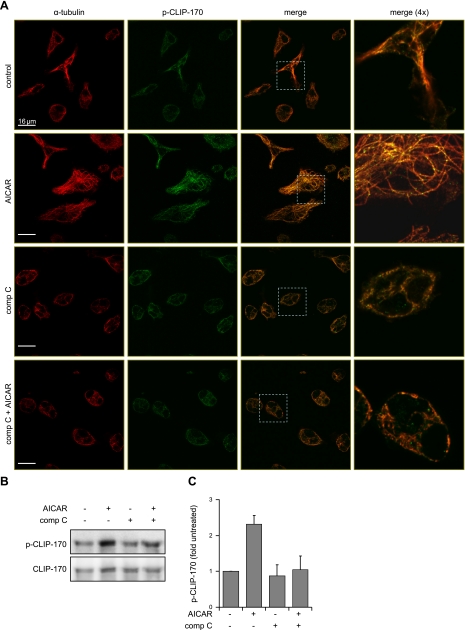
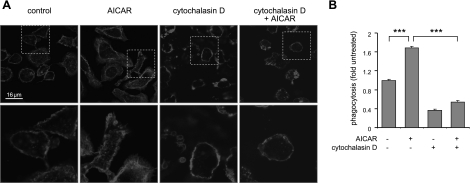
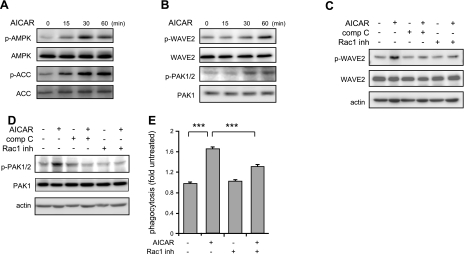
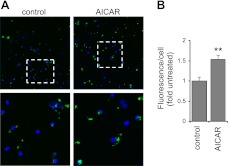
Although AMPK plays well-established roles in the modulation of energy balance, recent studies have shown that AMPK activation has potent anti-inflammatory effects. In the present experiments, we examined the role of AMPK in phagocytosis. We found that ingestion of Escherichia coli or apoptotic cells by macrophages increased AMPK activity. AMPK activation increased the ability of neutrophils or macrophages to ingest bacteria (by 46 ± 7.8 or 85 ± 26%, respectively, compared to control, P<0.05) and the ability of macrophages to ingest apoptotic cells (by 21 ± 1.4%, P<0.05 compared to control). AMPK activation resulted in cytoskeletal reorganization, including enhanced formation of actin and microtubule networks. Activation of PAK1/2 and WAVE2, which are downstream effectors of Rac1, accompanied AMPK activation. AMPK activation also induced phosphorylation of CLIP-170, a protein that participates in microtubule synthesis. The increase in phagocytosis was reversible by the specific AMPK inhibitor compound C, siRNA to AMPKα1, Rac1 inhibitors, or agents that disrupt actin or microtubule networks. In vivo, AMPK activation resulted in enhanced phagocytosis of bacteria in the lungs by 75 ± 5% vs. control (P<0.05). These results demonstrate a novel function for AMPK in enhancing the phagocytic activity of neutrophils and macrophages.


Figures

Figure 1.
Figure 1.
AMPK activation increases phagocytosis of E. coli by macrophages. A, B) Peritoneal macrophages (106 cells/ml) were incubated with E. coli (107 cells/ml) or apoptotic thymocytes (5×10⁶ cells/ml) for the indicated times. A) Representative Western blots. B) Ratios of phospho-AMPK to total AMPK. C) Peritoneal macrophages were cultured with AICAR (0 or 1 mM), metformin (0 or 500 μM), or berberine (0 or 10 μM) for 1.5 h. In designated experiments, cells were treated with compound C (comp C; 0 or 10 μM) for 30 min before exposure to AICAR, metformin, or berberine. Representative Western blots show the amounts of total and phospho-AMPK, as well as the levels of phospho-ACC. A second experiment provided similar results. D) Macrophages (1×10⁶) were cultured with or without AICAR (1 mM, 1.5 h), metformin (500 μM, 2.5 h), or berberine (10 μM, 2.5 h), and then were incubated with fluorescent E. coli (10-fold excess over cell numbers) for 15 min. The numbers of cells positive for E. coli uptake were determined using flow cytometry (means±sd from 3 independent experiments). In designated experiments, compound C (10 μM) was included for 30 min before treatment with the AMPK activators. ***P < 0.001 vs. untreated cells; +++P < 0.001 vs. AICAR only.
Figure 2.
Figure 2.
AMPK activation increases phagocytosis by macrophages. A) Peritoneal macrophages were cultured with or without AICAR or compound C (comp C) or the combination of AICAR and compound C, as described in Fig. 1B. Representative images show that activation of AMPK increased, whereas compound C diminished, uptake of fluorescent E. coli by the macrophages (means±sd, n=4). Green, E. coli; red, phalloidin; blue, nuclei. **P < 0.01; ***P < 0.001. B) Knockdown of AMPKα1 prevents AICAR-induced increase in macrophage phagocytosis. Representative Western blots show the amounts of AMPKα1 or actin in macrophages treated with nonspecific scramble siRNA (control) or specific siRNA to AMPKα1. C) Phagocytosis was measured in macrophages treated with control (scramble siRNA) or siRNA to AMPKα1. Numbers of cells positive for E. coli were determined using flow cytometry (means±sd from 3 independent experiments). ***P < 0.001 vs. control.
Figure 3.
Figure 3.
AMPK activation increases phagocytosis of synthetic bead and efferocytosis of apoptotic cells by macrophages. Macrophages were treated with or without AICAR (1 mM) for 1.5 h or metformin (500 μM) for 2.5 h and then incubated with fluorescent carboxylated beads or apoptotic neutrophils, followed by microscopic analysis. Quantitative data show an increase in the uptake of fluorescent beads (left panel) or apoptotic neutrophils by macrophages stimulated with AICAR (middle panel) or metformin (right panel). Data are means ± sd from 3 independent experiments. ***P < 0.001 vs. untreated cells.
Figure 4.
Figure 4.
AMPK activation affects microtubule network formation in macrophages. A) Confocal images show the patterns of α-tubulin in control macrophages or macrophages treated with AICAR and nocodazole or compound C (comp C). B) Macrophages were incubated with AICAR (0 or 1 mM) or nocodazole (20 μM) for 2 h, or nocodazole was added to cells 30 min before exposure to AICAR. Cells were then incubated with fluorescent E. coli for 15 min, and bacterial uptake was determined by flow cytometry (means±sd, n=3). ***P < 0.001.
Figure 5.
Figure 5.
AMPK regulates CLIP-170 phosphorylation and microtubule network formation. A) Representative images show fluorescent intensity and subcellular localization of α-tubulin and phospho-CLIP-170 in control macrophages and in macrophages treated with AICAR, compound C (comp C), or the combination of compound C and AICAR. Merged images (dotted white boxes) were magnified to determine colocalization of α-tubulin and phospho-CLIP-170 (yellow). Red, α-tubulin; green, phospho-Ser311-CLIP-170. B) Representative Western blots show total CLIP-170 and phospho-CLIP-170 in control macrophages and macrophages treated with AICAR, compound C, or the combination of compound C and AICAR. Quantitative data are calculated using ratio of phospho-CLIP-170/total CLIP-170. Data are means ± sd from 2 independent experiments.
Figure 6.
Figure 6.
Cytochalasin D diminishes the effects of AMPK activation on actin network formation and macrophage phagocytosis. Peritoneal macrophages were treated with cytochalasin D (0 or 15 μM) for 30 min, and then cultured with AICAR (0 or 1 mM) for 1 h. A) Representative images show fluorescent subcellular patterns of actin in control and treated cells. Areas indicated by dotted white boxes were magnified to demonstrate membrane ruffles. B) Macrophages were incubated with the combination of cytochalasin D (0 or 15 μM) and AICAR (0 or 1 mM) for 1 h followed by inclusion of fluorescent E. coli in the cultures for 15 min and then phagocytosis was determined using flow cytometry. Data are means ± sd. ***P <0.001.
Figure 7.
Figure 7.
Activation of Rac1 signaling cascade is required for AMPK-induced enhancement of macrophage phagocytosis. A, B) Representative Western blots show AICAR dose- and time-dependent activation of AMPK (total and phospho-AMPK or ACC; A) or effects of AMPK activation on total and phospho-WAVE or PAC1/2 (B) in macrophages. C, D) Macrophages were preincubated with compound C (comp C; 0 or 10 μM) or Rac1 inhibitor (NSC23766, 0 or 100 μM) for 30 min and then cultured with AICAR (0 or 1 mM) for 1 h. Representative Western blots are shown. Similar results were obtained from an additional independent experiment. E) Macrophages were treated with NSC23766 (0 or 100 μM) for 30 min and then incubated with AICAR (0 or 1 mM) for 1.5 h. After addition of fluorescent E. coli, phagocytosis was determined by flow-cytometry. Data are means ± sd. ***P < 0.001.
Figure 8.
Figure 8.
AMPK activation increases the phagocytic ability of macrophages under in vivo conditions in the lungs. Mice were injected with AICAR (0 or 500 mg/kg, i.p.) 4 h before intratracheal instillation of fluorescent E. coli. Representative images (A) and quantitative data (B) show increased uptake of bacteria by macrophages obtained from BAL of AICAR compared to control mice (means±sd, n=4). Green, E. coli; blue, nuclei. Areas in dotted white boxes are enlarged in bottom panels. **P < 0.01 vs. control.

References

    1. Iseli T. J., Oakhill J. S., Bailey M. F., Wee S., Walter M., van Denderen B. J., Castelli L. A., Katsis F., Witters L. A., Stapleton D., Macaulay S. L., Michell B. J., Kemp B. E. (2008) AMP-activated protein kinase subunit interactions: beta1:gamma1 association requires beta1 Thr-263 and Tyr-267. J. Biol. Chem. 283, 4799–4807 - PubMed
    1. Steinberg G. R., Kemp B. E. (2009) AMPK in health and disease. Physiol. Rev. 89, 1025–1078 - PubMed
    1. Scott J. W., Hawley S. A., Green K. A., Anis M., Stewart G., Scullion G. A., Norman D. G., Hardie D. G. (2004) CBS domains form energy-sensing modules whose binding of adenosine ligands is disrupted by disease mutations. J. Clin. Invest. 113, 274–284 - PMC - PubMed
    1. Towler M. C., Hardie D. G. (2007) AMP-activated protein kinase in metabolic control and insulin signaling. Circ. Res. 100, 328–341 - PubMed
    1. Stein S. C., Woods A., Jones N. A., Davison M. D., Carling D. (2000) The regulation of AMP-activated protein kinase by phosphorylation. Biochem. J. 345, 437–443 - PMC - PubMed

Publication types

MeSH terms