. 2011 Sep 2;333(6047):1262-6.
doi: 10.1126/science.1204076.

A gustotopic map of taste qualities in the mammalian brain

Affiliations

A gustotopic map of taste qualities in the mammalian brain

Xiaoke Chen et al. Science. .

Abstract

The taste system is one of our fundamental senses, responsible for detecting and responding to sweet, bitter, umami, salty, and sour stimuli. In the tongue, the five basic tastes are mediated by separate classes of taste receptor cells each finely tuned to a single taste quality. We explored the logic of taste coding in the brain by examining how sweet, bitter, umami, and salty qualities are represented in the primary taste cortex of mice. We used in vivo two-photon calcium imaging to demonstrate topographic segregation in the functional architecture of the gustatory cortex. Each taste quality is represented in its own separate cortical field, revealing the existence of a gustotopic map in the brain. These results expose the basic logic for the central representation of taste.


Figures

Fig. 1
Fig. 1. Two-photon imaging in the mouse insular cortex
(a) Photograph of a mouse brain highlighting the approximate location of our imaging studies in the primary taste cortex (yellow). Also shown are the superimposed drawings of two key vascular landmarks (MCA, middle cerebral artery; RV, rhinal vein; LOT, lateral olfactory tract). (b) Responses of a sweet-sensitive thalamic taste neuron to 300 mM sucrose; the box indicates the time and duration of the sweet stimulus. After identifying such taste responsive neurons, cells around the recording site were infected with an AAV2/hu11-GFP virus to label their terminal fields in layer 4 of gustatory cortex (panel c). (c) coronal section of a mouse brain (Bregma +1.0) stained with TO-PRO-3 (red). Shown is the location of the thalamocortical projections labeled after infection with the AAV2/hu11-GFP virus (white box). In order to triangulate this region in relation to the vascular landmarks, we injected DiI at the intersection between the RV and the MCA (pseudocolored in blue; solid arrow), and at 1 mm above (open arrow). (d) Images of bulk-loaded neurons and astrocytes in layer 2/3 of the primary gustatory cortex (see also Fig. S1) with Oregon Green 488 BAPTA-1 AM (green fluorescence) and sulforhodamine 101 (yellow labeled astrocytes). Animals were imaged in vivo after surgical craniotomy using two-photon microscopy. Scales: panel a, 1 mm, panel c, 1 mm; panel d, 100 µm.
Fig. 2
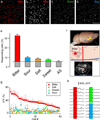
Fig. 2. Tastant-evoked responses in the bitter hot spot
(a) Bitter tastant stimulation of the tongue (single trial) evoked robust responses in the bitter hot spot; shown is an image illustrating changes in OGB-fluorescence to a 1 mM cycloheximide stimulus; approximately 35% of the loaded neurons responded with ΔF/F greater than 3.5 standard deviations above background (see also Fig. S7). (b–d). In sharp contrast to the sparse activity seen during application of other tastants (panels c and d; see text), neurons activated by bitter responded over multiple trials; cells that responded in at least 2 of 4 trials are labeled white (panel b). (e) Neurons in the bitter hot spot responded selectively to bitter but not to other taste stimuli (see methods for details) (n = 8). (f) Also shown is an illustration, and a bright-field image, depicting the approximate relation of the bitter cortical field (red circle) to the vascular landmarks; the dotted circles depict the location of the bitter hot spot in 4 additional animals (see Methods for details). The middle panel has been flattened to present a 2-dimensional view of this area of the brain. (g) Bitter-responsive neurons are highly tuned to bitter taste (red). The graph shows the rank-ordered ΔF/F of a set of bitter-responsive neurons in a six trial experiment to bitter stimuli versus other tastants; bitter = 1 mM cycloheximide, NaCl = 100 mM NaCl, sweet = 30 mM acesulfame K, sour = 10 mM citric acid. There was no apparent organization based on response amplitudes within the cluster (Fig. S8). (h) Representative OGB-fluorescence changes during a 10 s bitter (red), sweet (green), and sour (blue) stimulation. Scales (panels a–d) 100 µm, and (f) 0.5 mm. Error bars are mean ± s.e.m.
Fig. 3
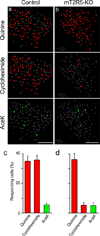
Fig. 3. Responses in the bitter hot spot are dependent on bitter taste receptor function
(a) Different bitter compounds activate the same hot spot in the cortex (see Fig. S3) (n = 4). (b) Animals lacking the bitter taste receptor for cycloheximide (T2R5-KO) selectively lack cortical responses to cycloheximide, but retain normal responses to other bitters (e.g. 10 mM quinine) (n = 2, 7 trials each tastant). (c–d) Quantitation of taste responses in the control and T2R5-KO animals; also shown are data for a sweet tastant (AceK), note the lack of responses in both control and KO animals. Scale (a, b) = 100 µm, error bars are mean ± s.e.m.
Fig. 4
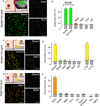
Fig. 4. The basic tastes are represented in a spatial map in primary taste cortex
(a–b) sweet taste is represented in its own cortical field (solid green circle), approximately 2.5 mm rostro-dorsal from the expected location of the bitter hot spot (red circle in upper left illustration). Also shown is the location of the sweet hot spot in 3 additional animals (green open circles). (a) Approximately 35% of the OGB-labeled neurons in the sweet cortical field respond in multiple trials to sweet taste stimulation of the tongue (green-labeled neurons), but not to other tastes (e.g. bitter and sour). (b) The responses are highly specific for sweet tastants (see also Fig. S7), including natural and artificial sweeteners. (c) umami taste is also represented in its own stereotypical hot spot, found approximately 1 mm ventral to the expected sweet cortical field (yellow circle). (d) As anticipated, responses are selective for umami tastants, including various L-amino acids, but not to D-amino acids or other taste qualities. (e–f) Low concentrations of sodium salt (100 mM NaCl) are known to activate a unique population of sodium sensing taste receptor cells (12), and are represented in a distinct cortical field (orange circle) approximately 1 mm equidistant to the expected sweet and umami hot spots. (f) Importantly, amiloride completely abolishes both the function of the sodium taste receptor, and the insular representation of sodium taste. Other salts are known not to activate the sodium sensor (12), and indeed are not represented in the sodium hot spot (e.g. KCl, MgCl2). See Fig. S5 for additional details on the sweet, umami and sodium responses. Scale bars = 100 µm; cortex diagram= 0.5 mm; error bars are mean ± s.e.m. The hot spots for the different tastes are too far from each other to be imaged on the same animal; reconstructions are based on multiple animals. A minimum of 4 animals, and 4 trials per animal/per tastant were used to define the sweet (n = 10 animals), umami (n = 5 animals) and sodium cortical fields (n = 4 animals; see methods for additional details).

Comment in

Similar articles

Cited by

References

    1. Li X, et al. Proc Natl Acad Sci U S A. 2002 Apr 2;99:4692. - PMC - PubMed
    1. Nelson G, et al. Nature. 2002 Mar 14;416:199. - PubMed
    1. Zhao GQ, et al. Cell. 2003 Oct 31;115:255. - PubMed
    1. Nelson G, et al. Cell. 2001 Aug 10;106:381. - PubMed
    1. Adler E, et al. Cell. 2000 Mar 17;100:693. - PubMed

Publication types