

Urine volume and change in estimated GFR in a community-based cohort study
- PMID: 21885793
- PMCID: PMC3359569
- DOI: 10.2215/CJN.01990211
Urine volume and change in estimated GFR in a community-based cohort study
Abstract
Background and objectives: The effect of increased fluid intake on kidney function is unclear. This study evaluates the relationship between urine volume and renal decline over 6 years in a large community-based cohort.
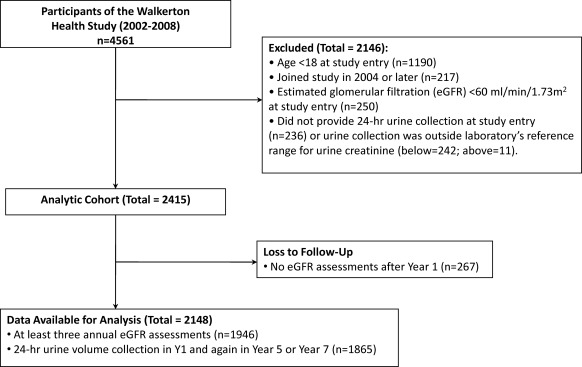
Design, setting, participants, & measurements: This prospective cohort study was undertaken in Canada from 2002 to 2008. We obtained 24-hour urine samples from adult participants with an estimated GFR (eGFR) ≥60 ml/min per 1.73 m(2) at study entry. Percentage annual change in eGFR from baseline was categorized as average decline <1% per year, between 1% and 4.9% (mild-to-moderate decline) or ≥5% (rapid decline).
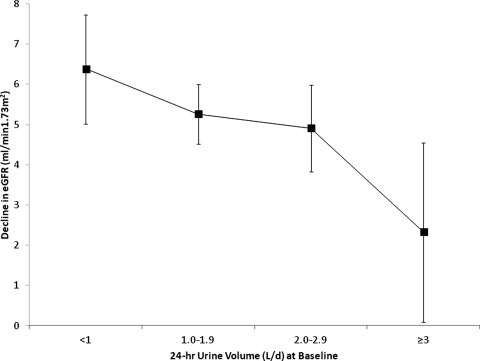
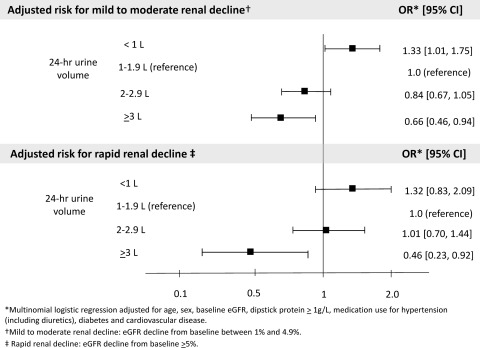
Results: 2148 participants provided valid 24-hour urine samples, grouped as <1 L/d (14.5%); 1 to 1.9 L/d (51.5%); 2 to 2.9 L/d (26.3%); and ≥3 L/d (7.7%). Baseline eGFR for each category of urine volume was 90, 88, 84, and 87 ml/min per 1.73 m(2), respectively. Overall, eGFR declined by 1% per year, with 10% demonstrating rapid decline and 40% demonstrating mild-to-moderate decline. An inverse, graded relationship was evident between urine volume and eGFR decline: For each increasing category of 24-hour urine volume, percentage annual eGFR decline was progressively slower, from 1.3%, 1.0%, 0.8%, to 0.5%, respectively; P = 0.02. Compared with those with urine volume 1 to 1.9 L/d, those with urine volume ≥3 L/d were significantly less likely to demonstrate mild-to-moderate decline (adjusted odds ratio 0.66; 95% confidence interval 0.46 to 0.94) or rapid decline (adjusted odds ratio 0.46; 95% confidence interval 0.23 to 0.92); adjusted for age, gender, baseline eGFR, medication use for hypertension (including diuretics), proteinuria, diabetes, and cardiovascular disease.
Conclusions: In this community-based cohort, decline in kidney function was significantly slower in those with higher versus lower urine volume.
Figures
Comment in
-
Fluid intake for kidney disease prevention: an urban myth?Clin J Am Soc Nephrol. 2011 Nov;6(11):2558-60. doi: 10.2215/CJN.09510911. Epub 2011 Oct 27. Clin J Am Soc Nephrol. 2011. PMID: 22034508 No abstract available.
-
Fluid intake and chronic kidney disease: effect of coaching an increase in fluid intake on kidney function decline.Intern Emerg Med. 2018 Dec;13(8):1283-1285. doi: 10.1007/s11739-018-1952-5. Epub 2018 Sep 22. Intern Emerg Med. 2018. PMID: 30244426 No abstract available.
References
-
- Wenzel UO, Hebert LA, Stahl RA, Krenz I: My doctor said I should drink a lot! Recommendations for fluid intake in patients with chronic kidney disease. Clin J Am Soc Nephrol 1: 344–346, 2006 - PubMed
-
- Valtin H: “Drink at least eight glasses of water a day.” Really? Is there scientific evidence for “8 x 8”? Am J Physiol Regul Integr Comp Physiol 283: R993–R1004, 2002 - PubMed
-
- Negoianu D, Goldfarb S: Just add water. J Am Soc Nephrol 19: 1041–1043, 2008 - PubMed
-
- Lette F, Dwyer JP: The fluid craze. Lancet 372: 782, 2008 - PubMed
Publication types
MeSH terms
LinkOut - more resources
Full Text Sources
Medical
Research Materials
Miscellaneous
