. 2011 Oct;60(10):2533-45.
doi: 10.2337/db10-1543. Epub 2011 Sep 1.

Mechanisms of control of the free Ca2+ concentration in the endoplasmic reticulum of mouse pancreatic β-cells: interplay with cell metabolism and [Ca2+]c and role of SERCA2b and SERCA3

Affiliations

Mechanisms of control of the free Ca2+ concentration in the endoplasmic reticulum of mouse pancreatic β-cells: interplay with cell metabolism and [Ca2+]c and role of SERCA2b and SERCA3

Magalie A Ravier et al. Diabetes. 2011 Oct.

Abstract

Objective: Sarco-endoplasmic reticulum Ca(2+)-ATPase 2b (SERCA2b) and SERCA3 pump Ca(2+) in the endoplasmic reticulum (ER) of pancreatic β-cells. We studied their role in the control of the free ER Ca(2+) concentration ([Ca(2+)](ER)) and the role of SERCA3 in the control of insulin secretion and ER stress.

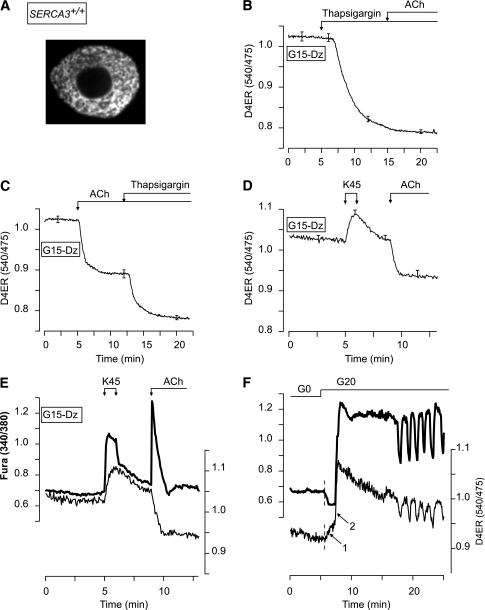
Research design and methods: β-Cell [Ca(2+)](ER) of SERCA3(+/+) and SERCA3(-/-) mice was monitored with an adenovirus encoding the low Ca(2+)-affinity sensor D4 addressed to the ER (D4ER) under the control of the insulin promoter. Free cytosolic Ca(2+) concentration ([Ca(2+)](c)) and [Ca(2+)](ER) were simultaneously recorded. Insulin secretion and mRNA levels of ER stress genes were studied.

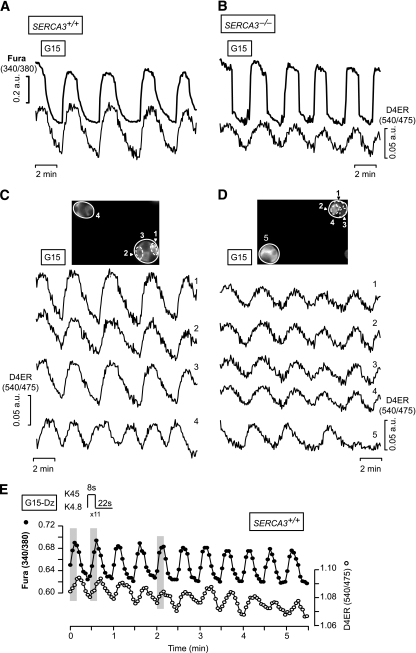
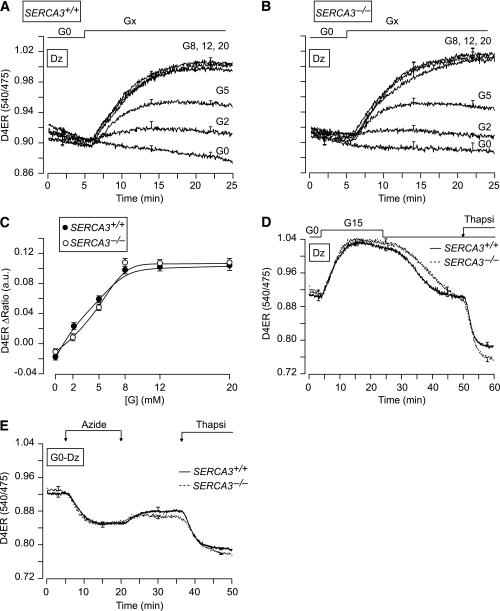
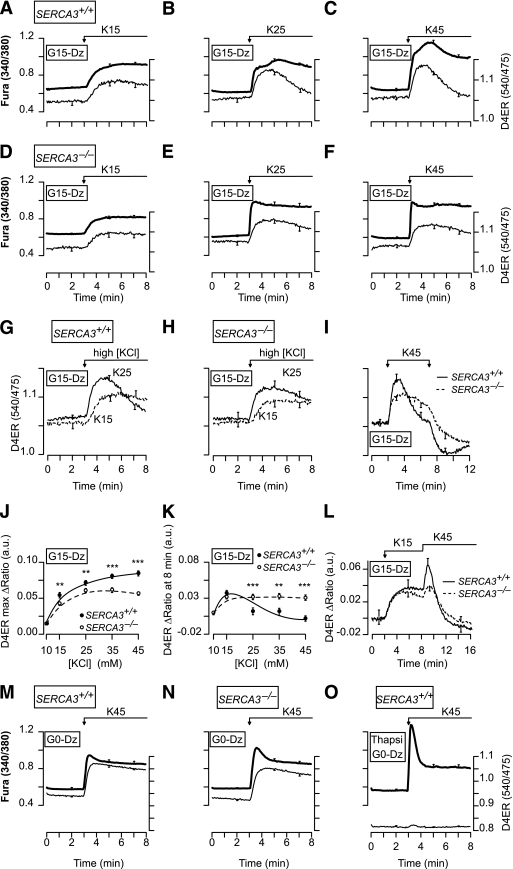
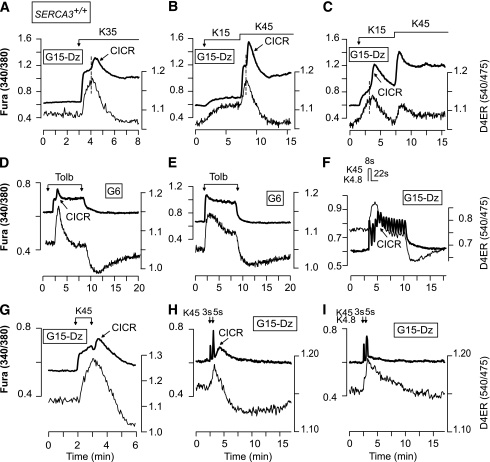
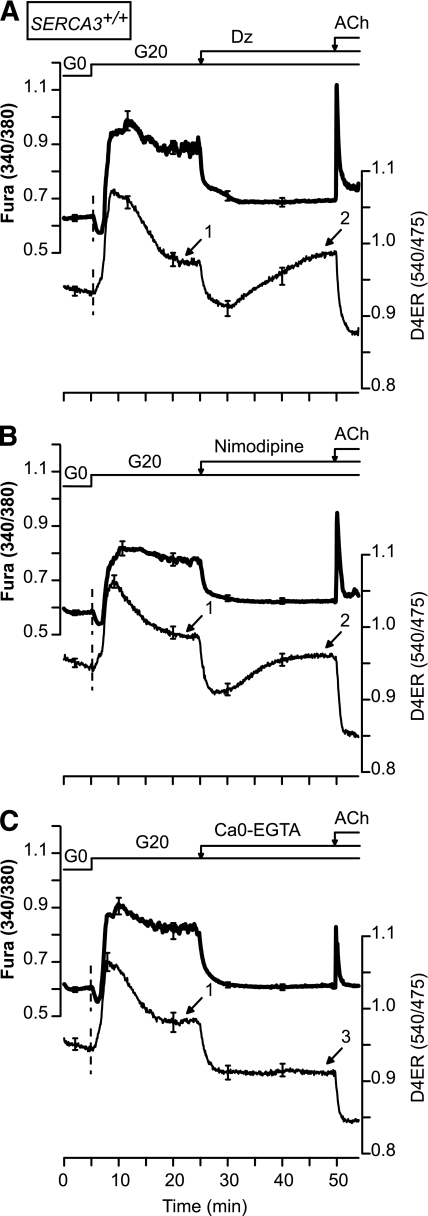
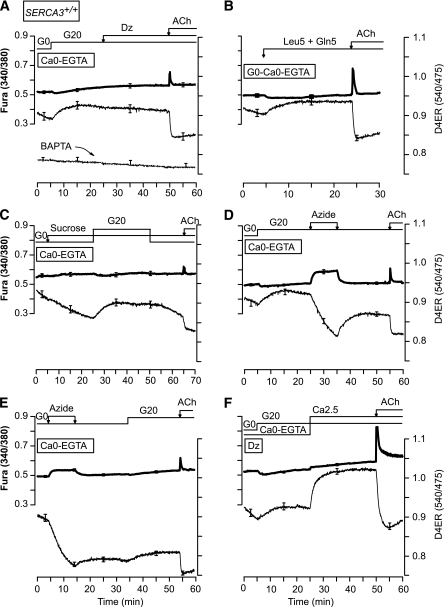
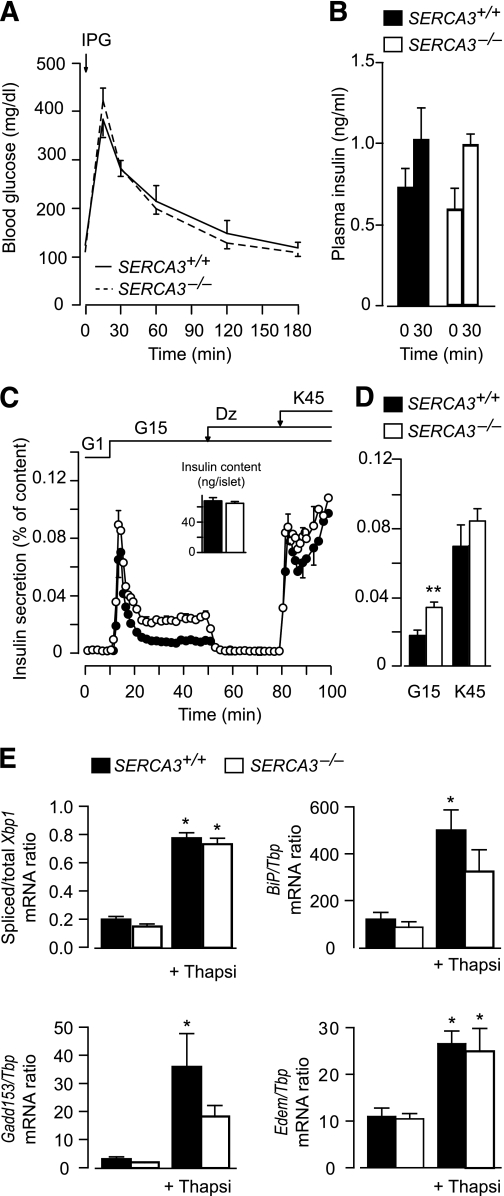
Results: Glucose elicited synchronized [Ca(2+)](ER) and [Ca(2+)](c) oscillations. [Ca(2+)](ER) oscillations were smaller in SERCA3(-/-) than in SERCA3(+/+) β-cells. Stimulating cell metabolism with various [glucose] in the presence of diazoxide induced a similar dose-dependent [Ca(2+)](ER) rise in SERCA3(+/+) and SERCA3(-/-) β-cells. In a Ca(2+)-free medium, glucose moderately raised [Ca(2+)](ER) from a highly buffered cytosolic Ca(2+) pool. Increasing [Ca(2+)](c) with high [K] elicited a [Ca(2+)](ER) rise that was larger but more transient in SERCA3(+/+) than SERCA3(-/-) β-cells because of the activation of a Ca(2+) release from the ER in SERCA3(+/+) β-cells. Glucose-induced insulin release was larger in SERCA3(-/-) than SERCA3(+/+) islets. SERCA3 ablation did not induce ER stress.

Conclusions: [Ca(2+)](c) and [Ca(2+)](ER) oscillate in phase in response to glucose. Upon [Ca(2+)](c) increase, Ca(2+) is taken up by SERCA2b and SERCA3. Strong Ca(2+) influx triggers a Ca(2+) release from the ER that depends on SERCA3. SERCA3 deficiency neither impairs Ca(2+) uptake by the ER upon cell metabolism acceleration and insulin release nor induces ER stress.


Figures

FIG. 1.
FIG. 1.
Validation of D4ER as a reporter of [Ca2+]ER changes and of combined measurements of [Ca2+]c and [Ca2+]ER. A: Confocal image of a single β-cell expressing D4ER. B–D: β-Cell [Ca2+]ER measurements. Cells were perifused with 15 mmol/L glucose (G15) in the presence of 250 µmol/L of the KATP channel opener Dz. As indicated, 1 µmol/L thapsigargin, 100 µmol/L ACh, or 45 mmol/L KCl (K45) was added. E and F: Simultaneous measurement of [Ca2+]c (FuraPE3) and [Ca2+]ER (D4ER) in β-cells. E: The perifusion medium contained 15 mmol/L glucose (G15) and 250 µmol/L Dz throughout. β-Cells were stimulated with 45 mmol/L KCl (K45) and 100 µmol/L ACh as indicated. F: β-Cells were perifused in glucose-free medium (G0) and then stimulated with 20 mmol/L glucose (G20). B–D: Means ± SE for 23–44 cells from three to four experiments with three islet preparations. E and F: Representative traces from 9 to 42 cells from three experiments with three islet preparations.
FIG. 2.
FIG. 2.
[Ca2+]ER oscillations are synchronized to glucose- or high KCl–induced [Ca2+]c oscillations in β-cells. A and B: Simultaneous measurements of [Ca2+]c (FuraPE3) and [Ca2+]ER (D4ER) in β-cells from SERCA3+/+ (A) or SERCA3−/− (B) mice perifused with 15 mmol/L glucose (G15). C and D: Changes in [Ca2+]ER analyzed in the whole-cluster or -cell regions indicated in the pictures at the top of each panel for SERCA3+/+ (C) or SERCA3−/− β-cells (D). E: SERCA3+/+ β-cells were submitted to pulses of 4.8 (K4.8) and 45 mmol/L KCl (K45) applied at a frequency (two per minute) and at the duration indicated at the top of the panel and mimicking the spontaneous oscillations of the electrical activity observed in islets stimulated by 10 mmol/L. The perifusion medium contained 15 mmol/L glucose (G15) and 250 µmol/L Dz throughout. The shaded areas highlight the synchronicity between [Ca2+]c and [Ca2+]ER. Values are means ± SE for 29–35 cells (AD) or representative trace for 15 cells (E) from three experiments with three islet preparations.
FIG. 3.
FIG. 3.
Metabolic dependency of Ca2+ uptake by the ER. A and B: [Ca2+]ER (D4ER) measurements in β-cells from SERCA3+/+ (A) or SERCA3−/− (B) mice. After a 30-min preincubation in a glucose-free medium (G0), β-cells were perifused with various [glucose] (Gx) ranging from 2 to 20 mmol/L, as indicated. The Dz concentration was 250 µmol/L throughout. C: Dose-response curves of the experiments illustrated in A and B. D and E: The perifusion medium containing 250 µmol/L Dz was a glucose-free medium (G0) throughout (E) or was supplemented with 15 mmol/L glucose (G15) as indicated (D). Azide (5 mmol/L) and 1 µmol/L thapsigargin (Thapsi) were added as indicated. Values are means ± SE for 16–46 cells from three to four experiments with three to four islet preparations.
FIG. 4.
FIG. 4.
Characteristics of the [Ca2+]ER changes elicited by rises in [Ca2+]c of various amplitudes in β-cells from SERCA3+/+ and SERCA3−/− mice. AF: Simultaneous measurement of [Ca2+]c (FuraPE3) and [Ca2+]ER (D4ER) in β-cells from SERCA3+/+ (AC) or SERCA3−/− (D–F) mice perifused with 15 mmol/L glucose (G15) and 250 µmol/L Dz. Cells were stimulated with 15 mmol/L (K15) (A and D), 25 mmol/L (K25) (B and E), or 45 mmol/L (K45) K (C and F) as indicated. GI and L: Comparison of [Ca2+]ER (D4ER) changes in β-cells from SERCA3+/+ (G, I, and L) or SERCA3−/− (H, I, and L) mice under various KCl stimulations, as indicated. J and K: Quantifications of the effects of the various [KCl] on the maximal [Ca2+]ER achieved after the change in [KCl] (J), and on [Ca2+]ER 5 min after the change in [KCl] (K). They show that [KCl] dose dependently increased [Ca2+]ER soon after the depolarization, but not 5 min after the depolarization as the [Ca2+]ER rise became smaller for [KCl] >15 mmol/L. **P < 0.01 and ***P < 0.001, for the comparison between SERCA3+/+ and SERCA3−/− islets at each [KCl], respectively. MO: Simultaneous measurement of [Ca2+]c (FuraPE3) and [Ca2+]ER (D4ER) in β-cells from SERCA3+/+ (M and O) or SERCA3−/− (N) mice perifused with a glucose-free medium (G0) and 250 µmol/L Dz, and stimulated with 45 mmol/L KCl as indicated. O: β-cells were pretreated for 30 min with 1 μmol/L thapsigargin (Thapsi) prior to the experiments. Values are means ± SE for 29–81 cells from three to six experiments with three to four islet preparations.
FIG. 5.
FIG. 5.
Simultaneous measurement of [Ca2+]c (FuraPE3) and [Ca2+]ER (D4ER) reveals that in some (A–D and FH), but not all (E and I), β-cells from SERCA3+/+ mice, stimulation with high [KCl] or tolbutamide induces a CICR that is detectable by the antiparallel changes in [Ca2+]c and [Ca2+]ER. The perifusion medium contained 15 mmol/L glucose (G15) and 250 µmol/L Dz (AC, F, and GI), or 6 mmol/L glucose (G6) (D and E). AC and G: β-Cells were stimulated with the indicated [KCl]. D and E: β-Cells were stimulated with 250 µmol/L tolbutamide (Tolb). F: β-Cells were submitted to pulses of 4.8 (K4.8) and 45 mmol/L KCl (K45) applied at a frequency (two per minute) and with a duration indicated on the top of the panel and mimicking the spontaneous oscillations of the electrical activity observed in islets stimulated by 10 mmol/L. H and I: β-Cells were submitted to two pulses of 45 mmol/L KCl (K45) of 3 and 5 s when indicated by the arrows. This illustrates the extremely fast uptake capacity of the ER as a [Ca2+]ER rise was already observed during a 3-s depolarization with K45. Values are representative traces for 33/35 (A), 31/51 (B), 6/51 (C), 28/38 (D), 10/38 (E), 34/41 (F), 10/17 (G), 2/35 (H), and 33/35 (I) cells from three experiments with three islet preparations.
FIG. 6.
FIG. 6.
The ER decreases or increases its [Ca2+] to compensate for, respectively, a sustained increase or decrease in [Ca2+]c. [Ca2+]ER (D4ER) was measured in β-cells from SERCA3+/+ mice. The glucose concentration (G) was increased from 0 to 20 mmol/L before the addition of 250 µmol/L Dz (A) or 1 µmol/L nimodipine (B) or the removal of extracellular Ca2+ (Ca0-EGTA) (C). ACh (100 µmol/L) was added at the end of the experiments. Values are means ± SE for 22–42 cells from three experiments with three islet preparations.
FIG. 7.
FIG. 7.
Characteristics of Ca2+ uptake by the ER in response to activation of cell metabolism and during blockade of Ca2+ influx through voltage-dependent Ca2+ channels. [Ca2+]ER (D4ER) was measured in β-cells from SERCA3+/+ mice perifused with a Ca2+-free medium (Ca0-EGTA) throughout (AE) or only at the beginning of the experiment (F). A and CF: The glucose concentration was increased from 0 (G0) to 20 mmol/L (G20) before the addition of 250 µmol/L Dz (A) or 5 mmol/L azide (D), or the readmission of 2.5 mmol/L CaCl2 (Ca2.5) (F), or after the application of 20 mmol/L sucrose (C) or 5 mmol/L azide (E). B: The medium was supplemented with 5 mmol/L leucine and 5 mmol/L glutamine (Leu5 + Gln5) when indicated. AF: ACh (100 µmol/L ) was added at the end of the experiments. Values are means ± SE for 23–44 cells from three experiments with three islet preparations.
FIG. 8.
FIG. 8.
SERCA3 ablation does not affect glucose tolerance, increases glucose-induced insulin release, and does not induce ER stress. A and B: Changes in blood glucose (A) and plasma insulin levels (B) in SERCA3+/+ and SERCA3−/− mice in response to an intraperitoneal glucose tolerance test (2.4 g/kg body weight). C: Batches of 25–30 SERCA3+/+ and SERCA3−/− islets were perifused with a medium containing 1 or 15 mmol/L glucose (G) or 250 µmol/L Dz, as indicated. The [KCl] of the medium was increased from 4.8 to 45 mmol/L when indicated. Insulin secretion is expressed as percentage of islet insulin content. Values are means ± SE of four to five experiments. D: Integrated insulin secretion calculated in the experiments shown in C from minute 10 to 50 for glucose stimulation and from minute 80 to 100 for K45 stimulation. E: After isolation, islets from SERCA3−/− mice and SERCA3+/+ mice were precultured for 1 week in serum-free RPMI 1640 medium containing 10 mmol/L glucose and 5 g/L BSA. They were then cultured 18 h in the same medium with or without 1 µmol/L thapsigargin (TG). After culture, islet total RNA was extracted and reverse-transcribed into cDNA as previously described (50). Xbp1 mRNA splicing and Gene:Tbp mRNA ratio were measured by PCR as described earlier (50), with the exception of the use of mouse-specific primers (Xbp1 sense 5′-CAAGGGGAGTGGAGTAAGGC-3′ and antisense 5′-GGCAACAGTGTCAGAGTCCAT-3′; other primers see Marhfour et al. [27]). Data are means ± SEM for three islet preparations. *P < 0.05 for the effect of TG in the same type of islets; there were no significant differences between SERCA3+/+ and SERCA3−/− islets.

Similar articles

Cited by

References

    1. Gilon P, Henquin JC. Influence of membrane potential changes on cytoplasmic Ca2+ concentration in an electrically excitable cell, the insulin-secreting pancreatic B-cell. J Biol Chem 1992;267:20713–20720 - PubMed
    1. Rorsman P. The pancreatic beta-cell as a fuel sensor: an electrophysiologist’s viewpoint. Diabetologia 1997;40:487–495 - PubMed
    1. Váradi A, Molnár E, Ostenson CG, Ashcroft SJ. Isoforms of endoplasmic reticulum Ca(2+)-ATPase are differentially expressed in normal and diabetic islets of Langerhans. Biochem J 1996;319:521–527 - PMC - PubMed
    1. Arredouani A, Guiot Y, Jonas JC, et al. SERCA3 ablation does not impair insulin secretion but suggests distinct roles of different sarcoendoplasmic reticulum Ca(2+) pumps for Ca(2+) homeostasis in pancreatic beta-cells. Diabetes 2002;51:3245–3253 - PubMed
    1. Varadi A, Rutter GA. Dynamic imaging of endoplasmic reticulum Ca2+ concentration in insulin-secreting MIN6 Cells using recombinant targeted cameleons: roles of sarco(endo)plasmic reticulum Ca2+-ATPase (SERCA)-2 and ryanodine receptors. Diabetes 2002;51(Suppl. 1):S190–S201 - PubMed

Publication types

MeSH terms