. 2011 Nov;60(11):2975-84.
doi: 10.2337/db11-0478. Epub 2011 Sep 1.

miR-146a-Mediated extracellular matrix protein production in chronic diabetes complications

Affiliations

miR-146a-Mediated extracellular matrix protein production in chronic diabetes complications

Biao Feng et al. Diabetes. 2011 Nov.

Abstract

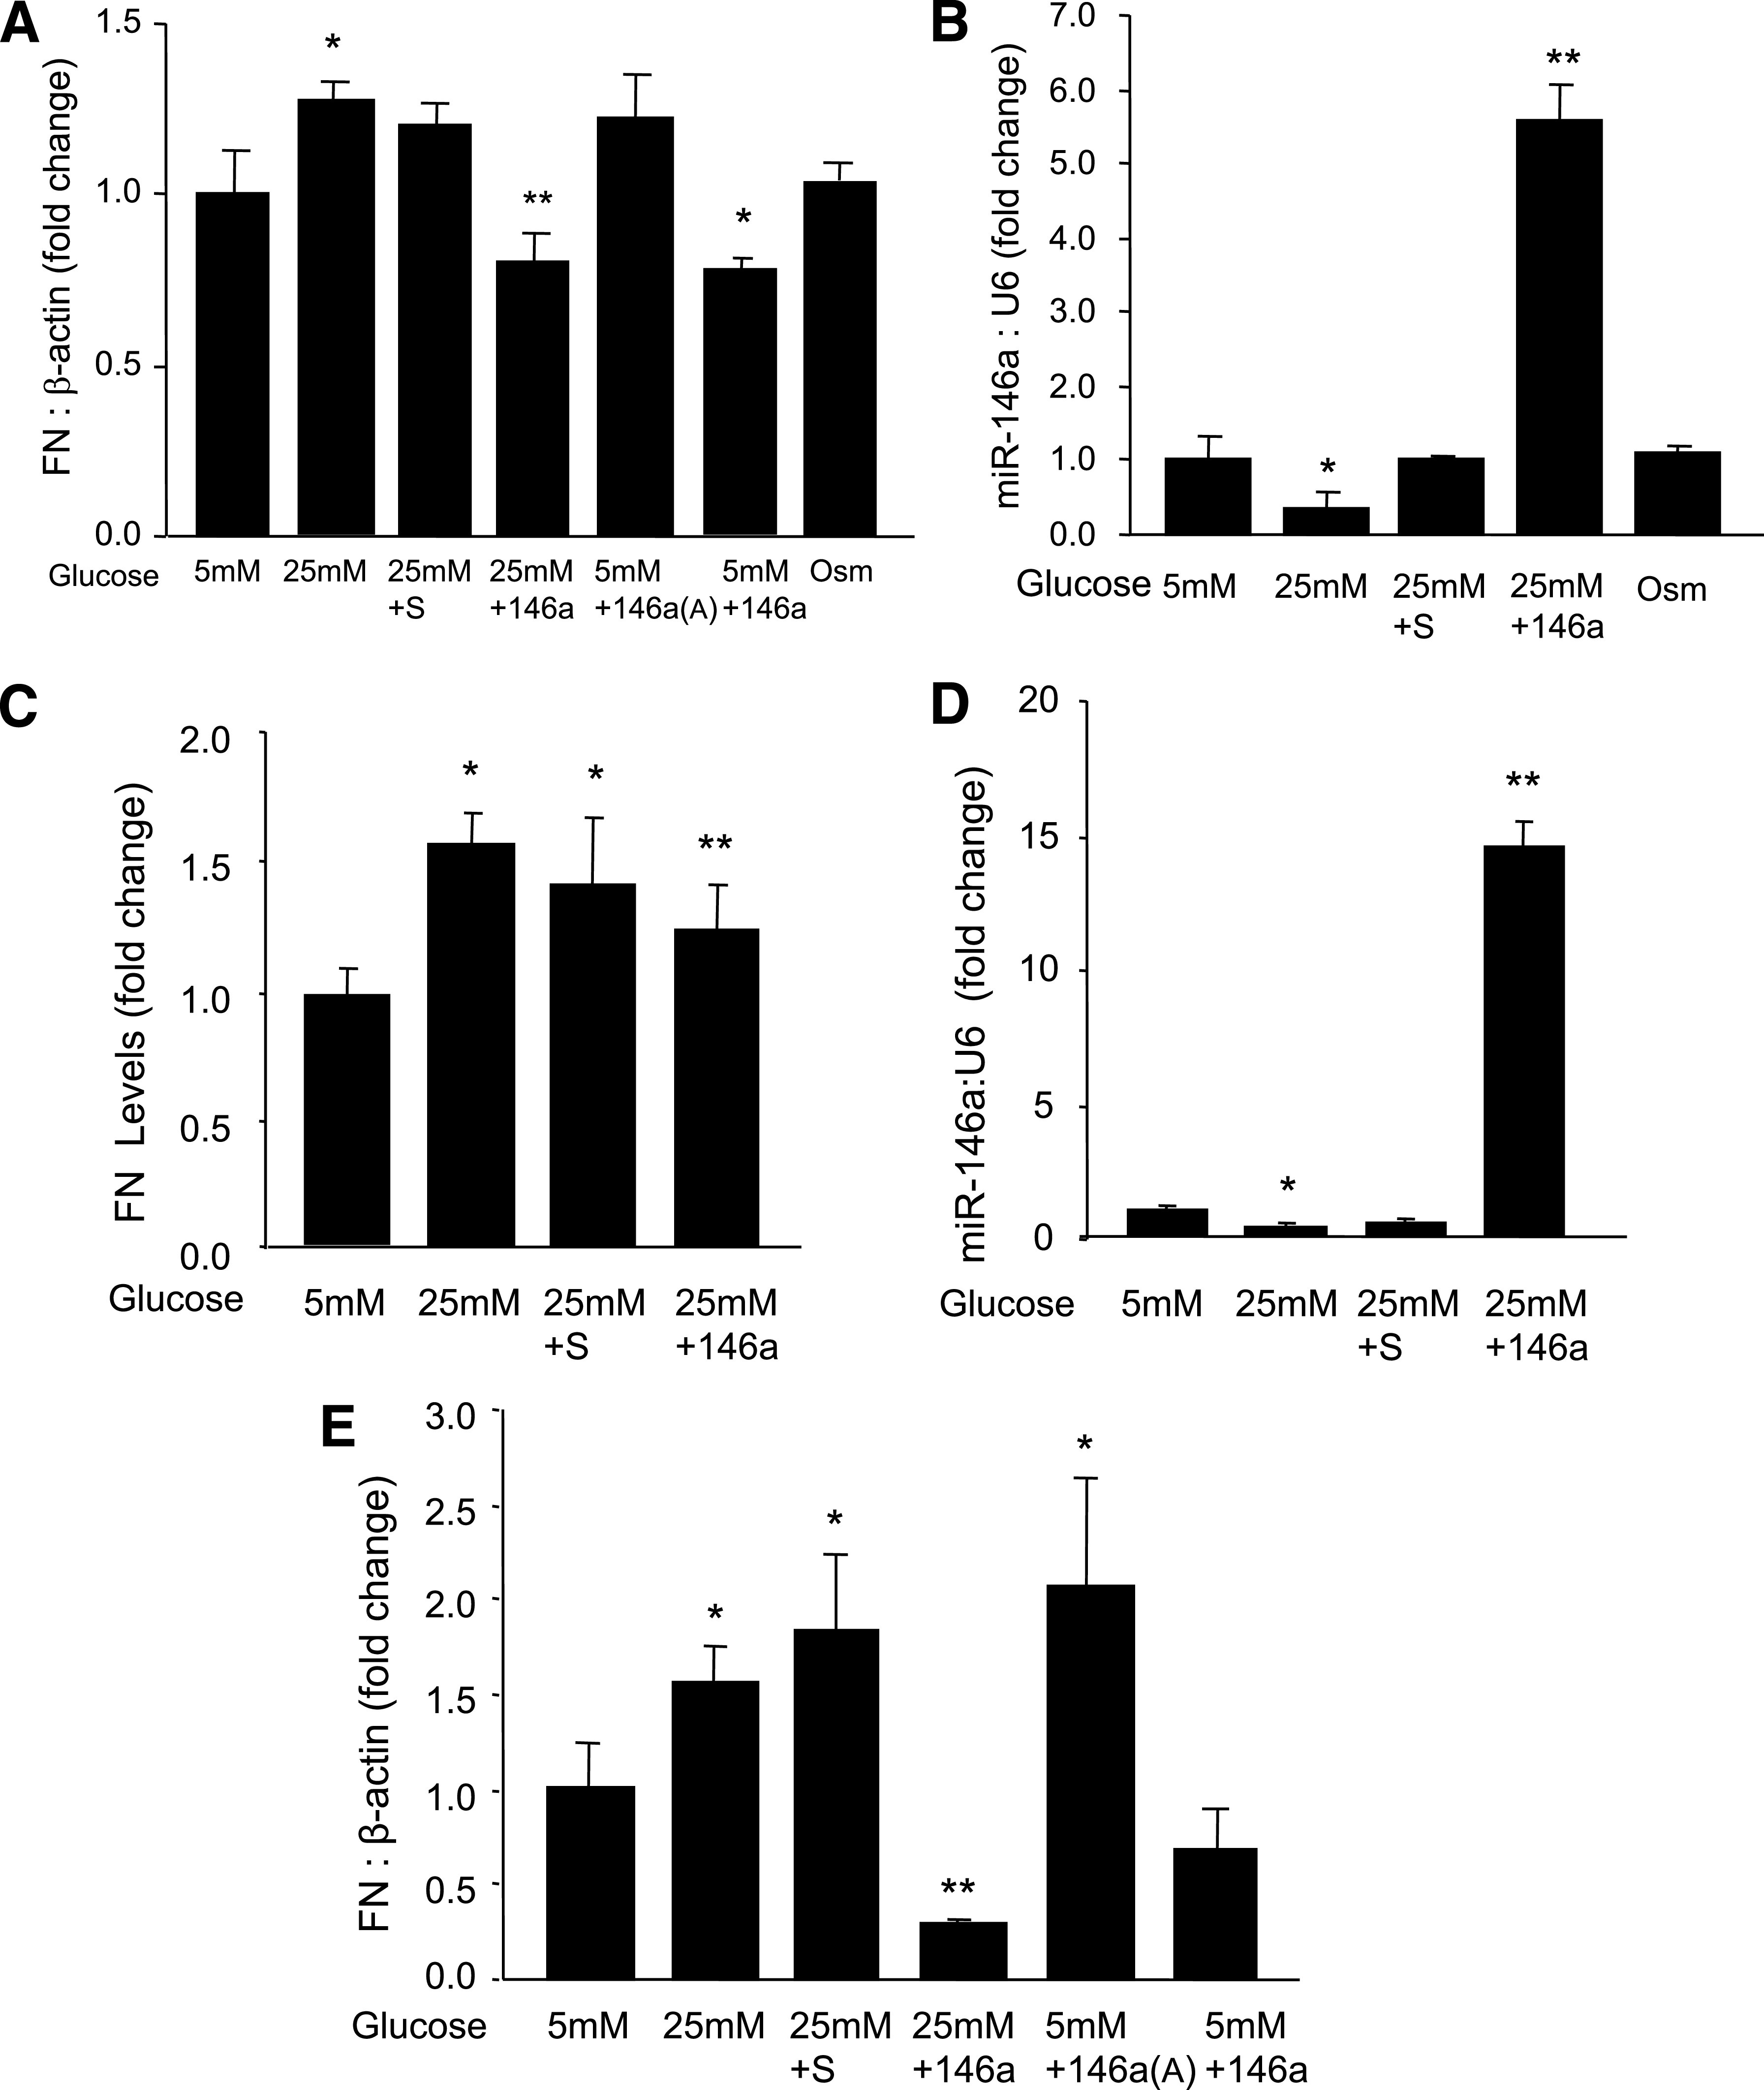
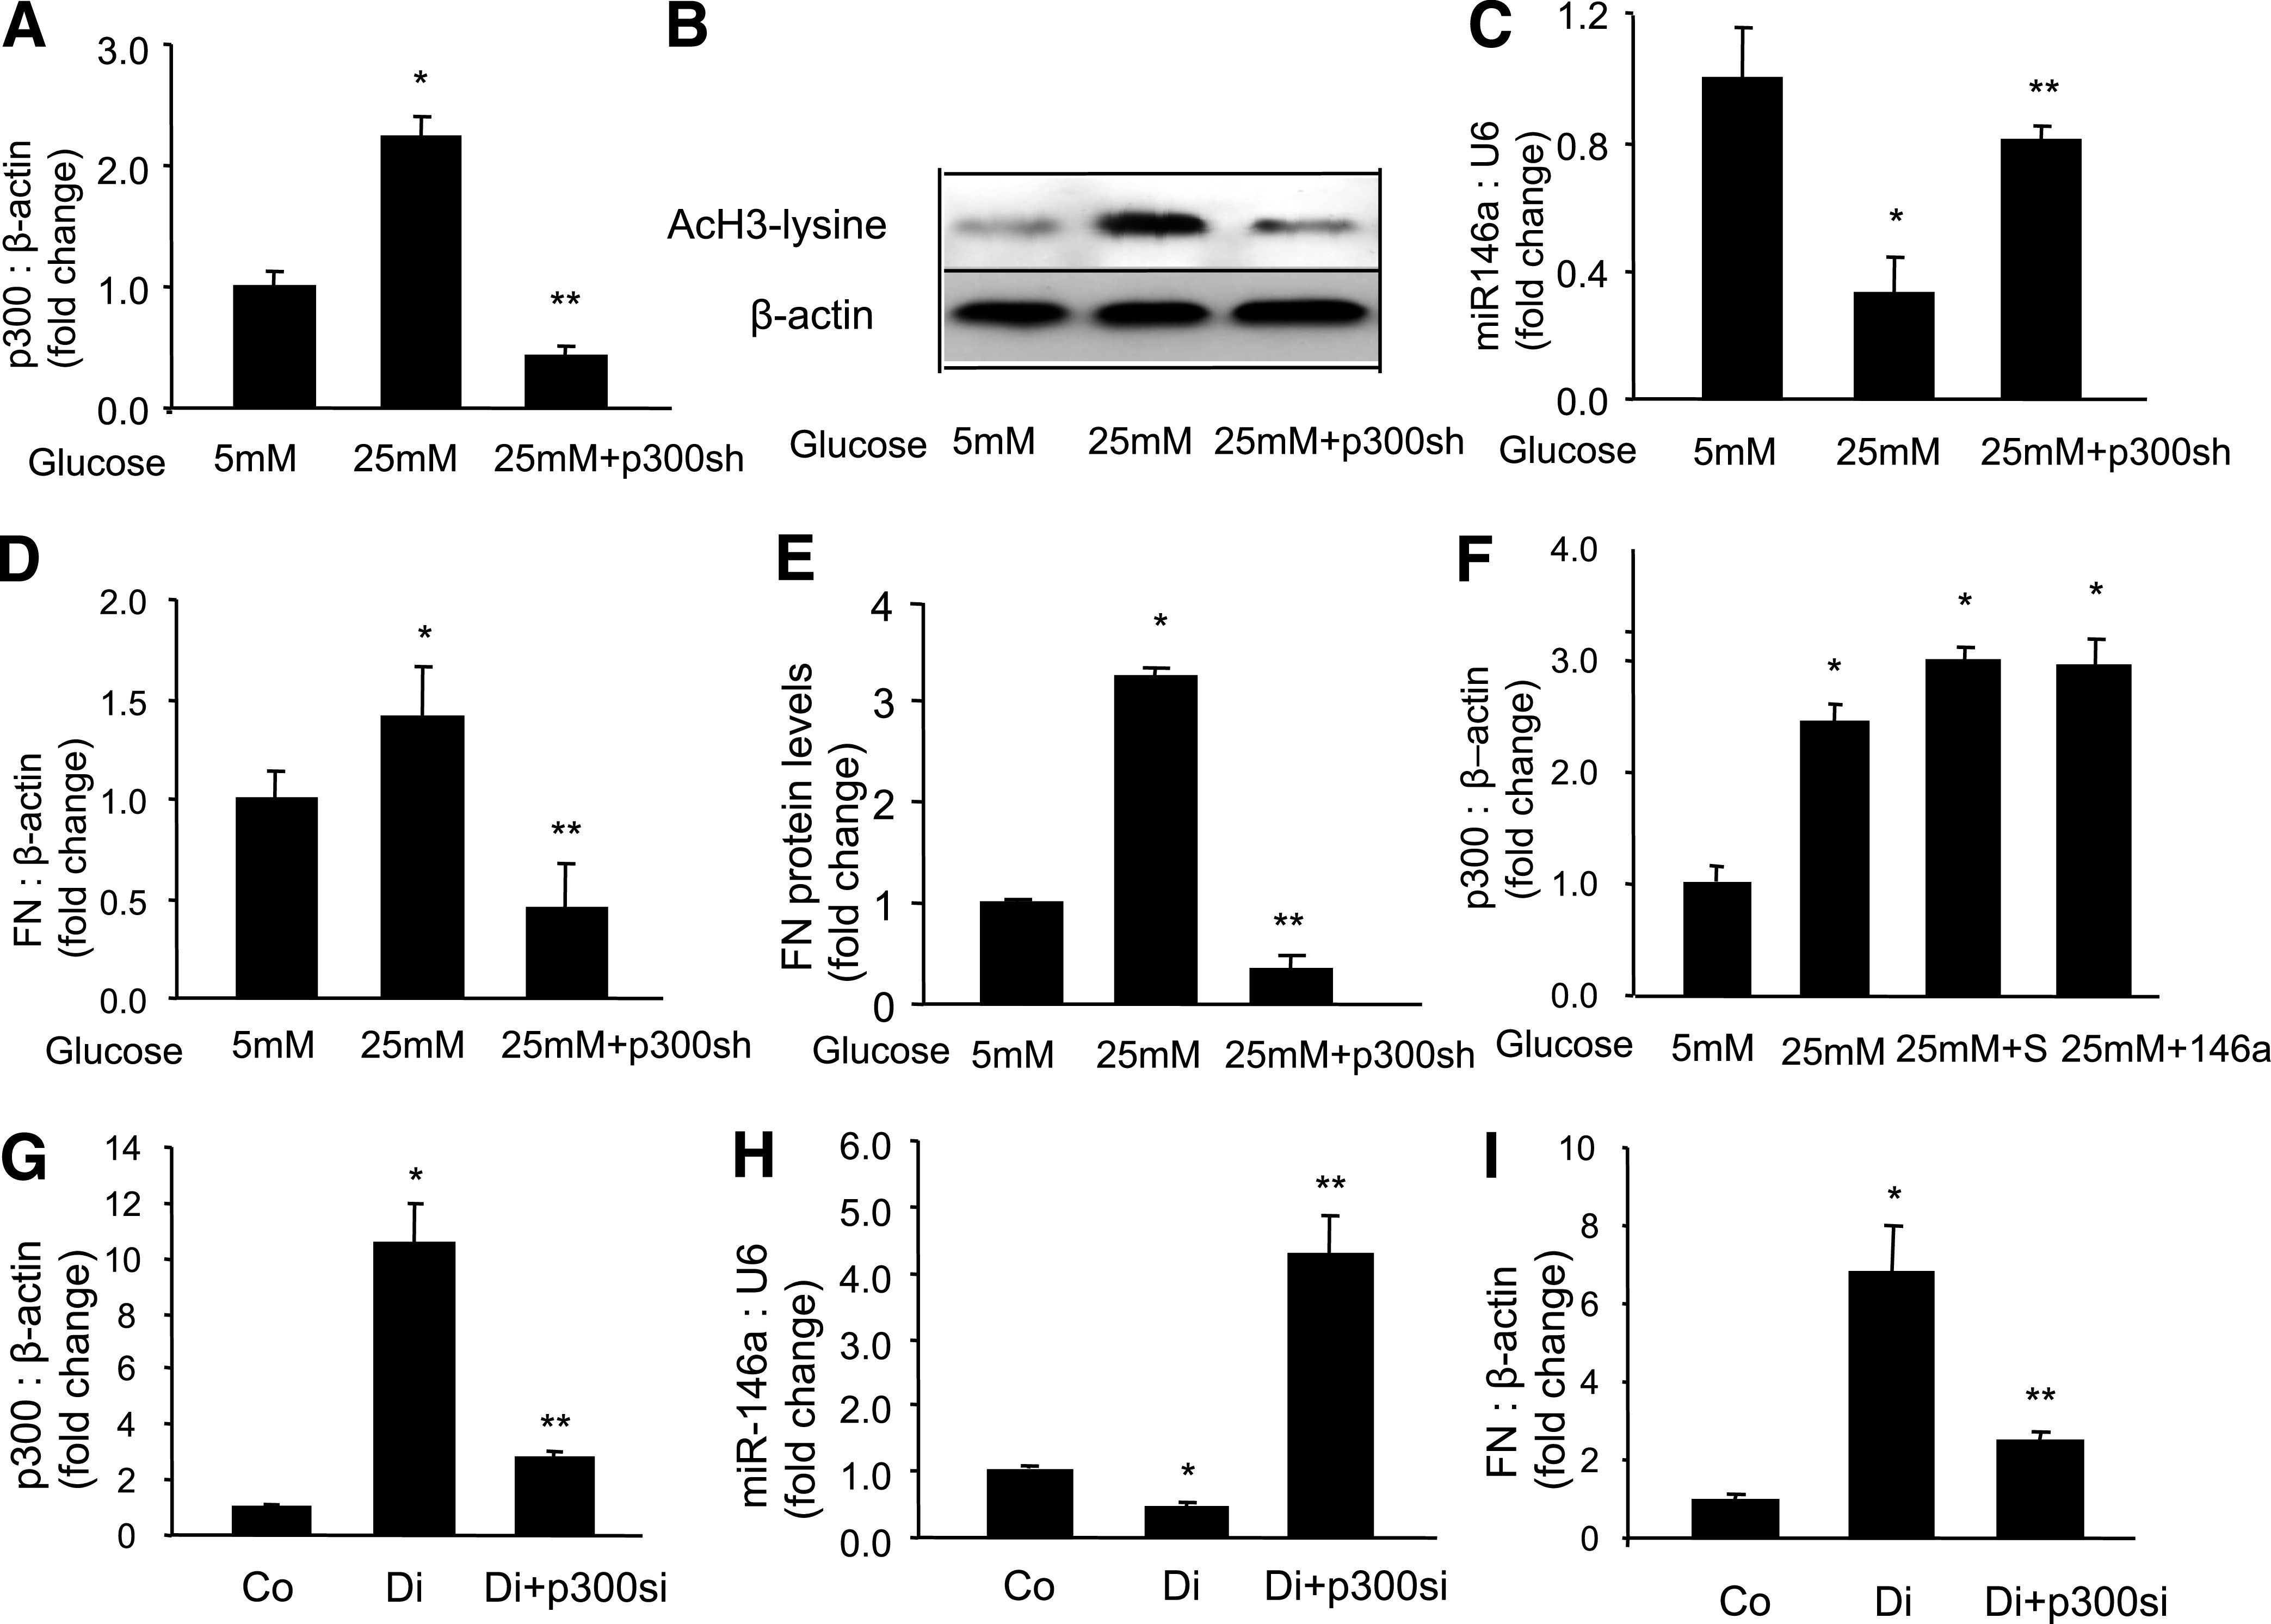
Objective: MicroRNAs (miRNAs), through transcriptional regulation, modulate several cellular processes. In diabetes, increased extracellular matrix protein fibronectin (FN) production is known to occur through histone acetylator p300. Here, we investigated the role of miR-146a, an FN-targeting miRNA, on FN production in diabetes and its relationship with p300.

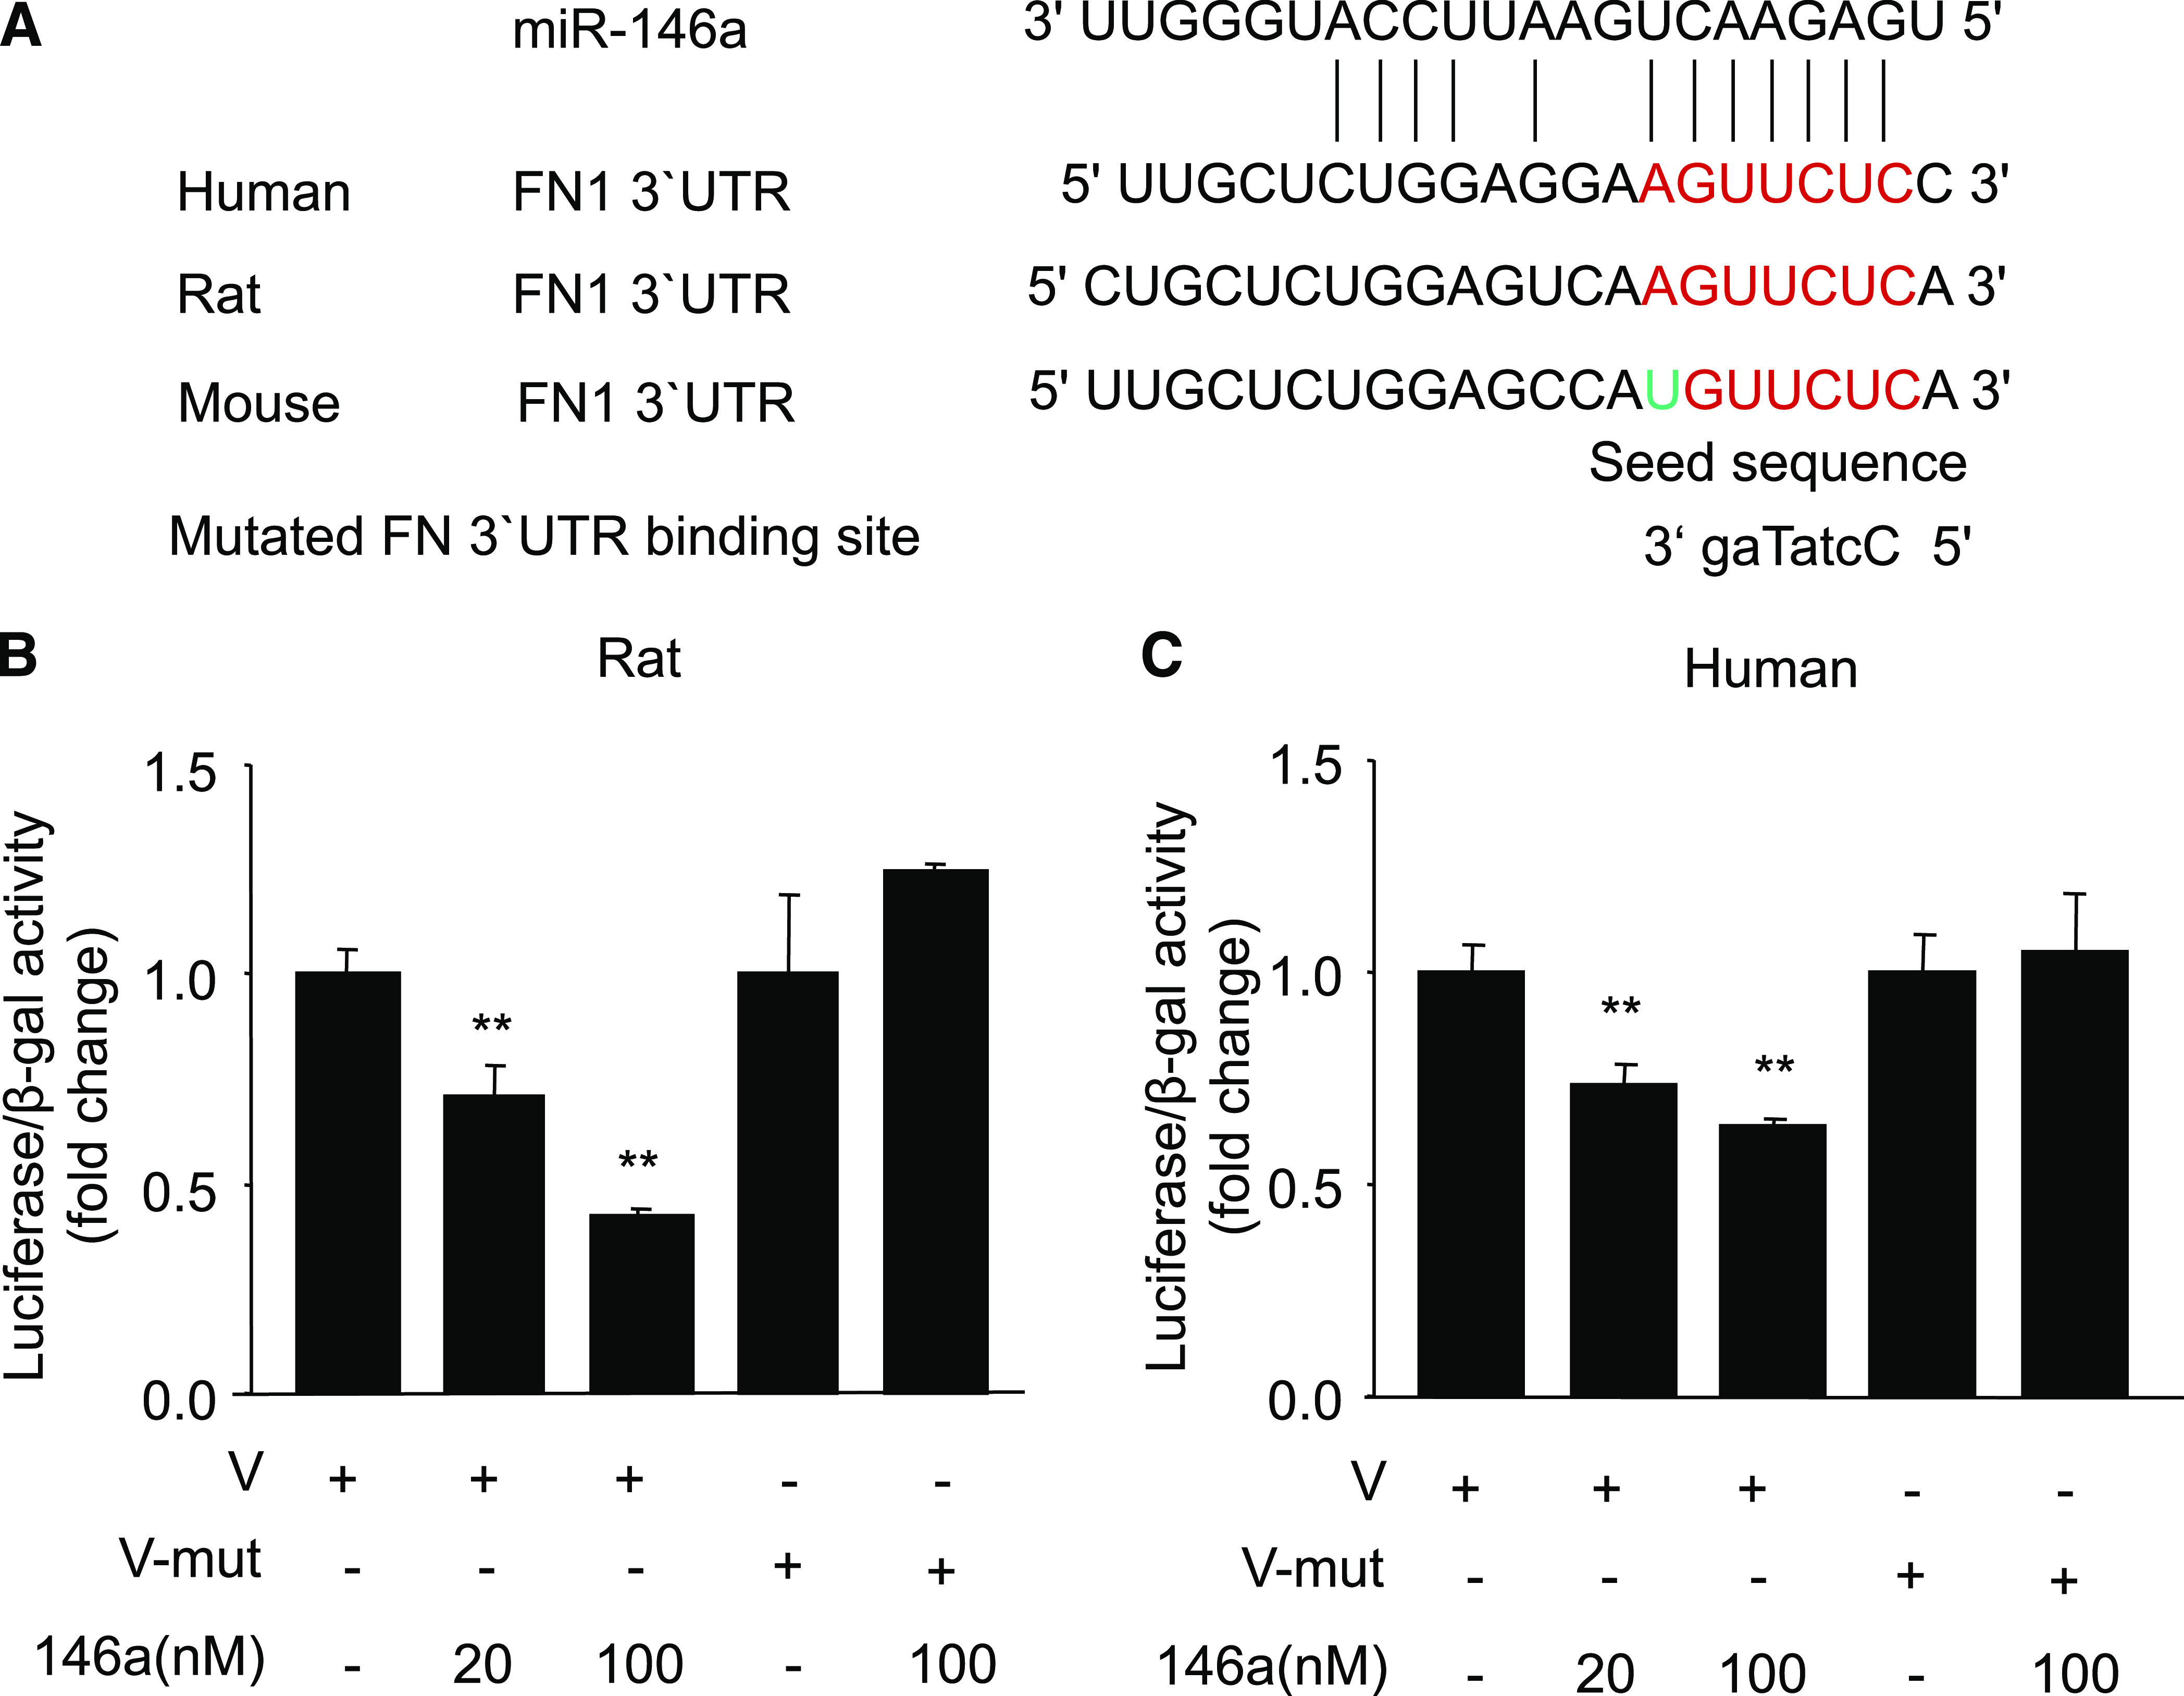
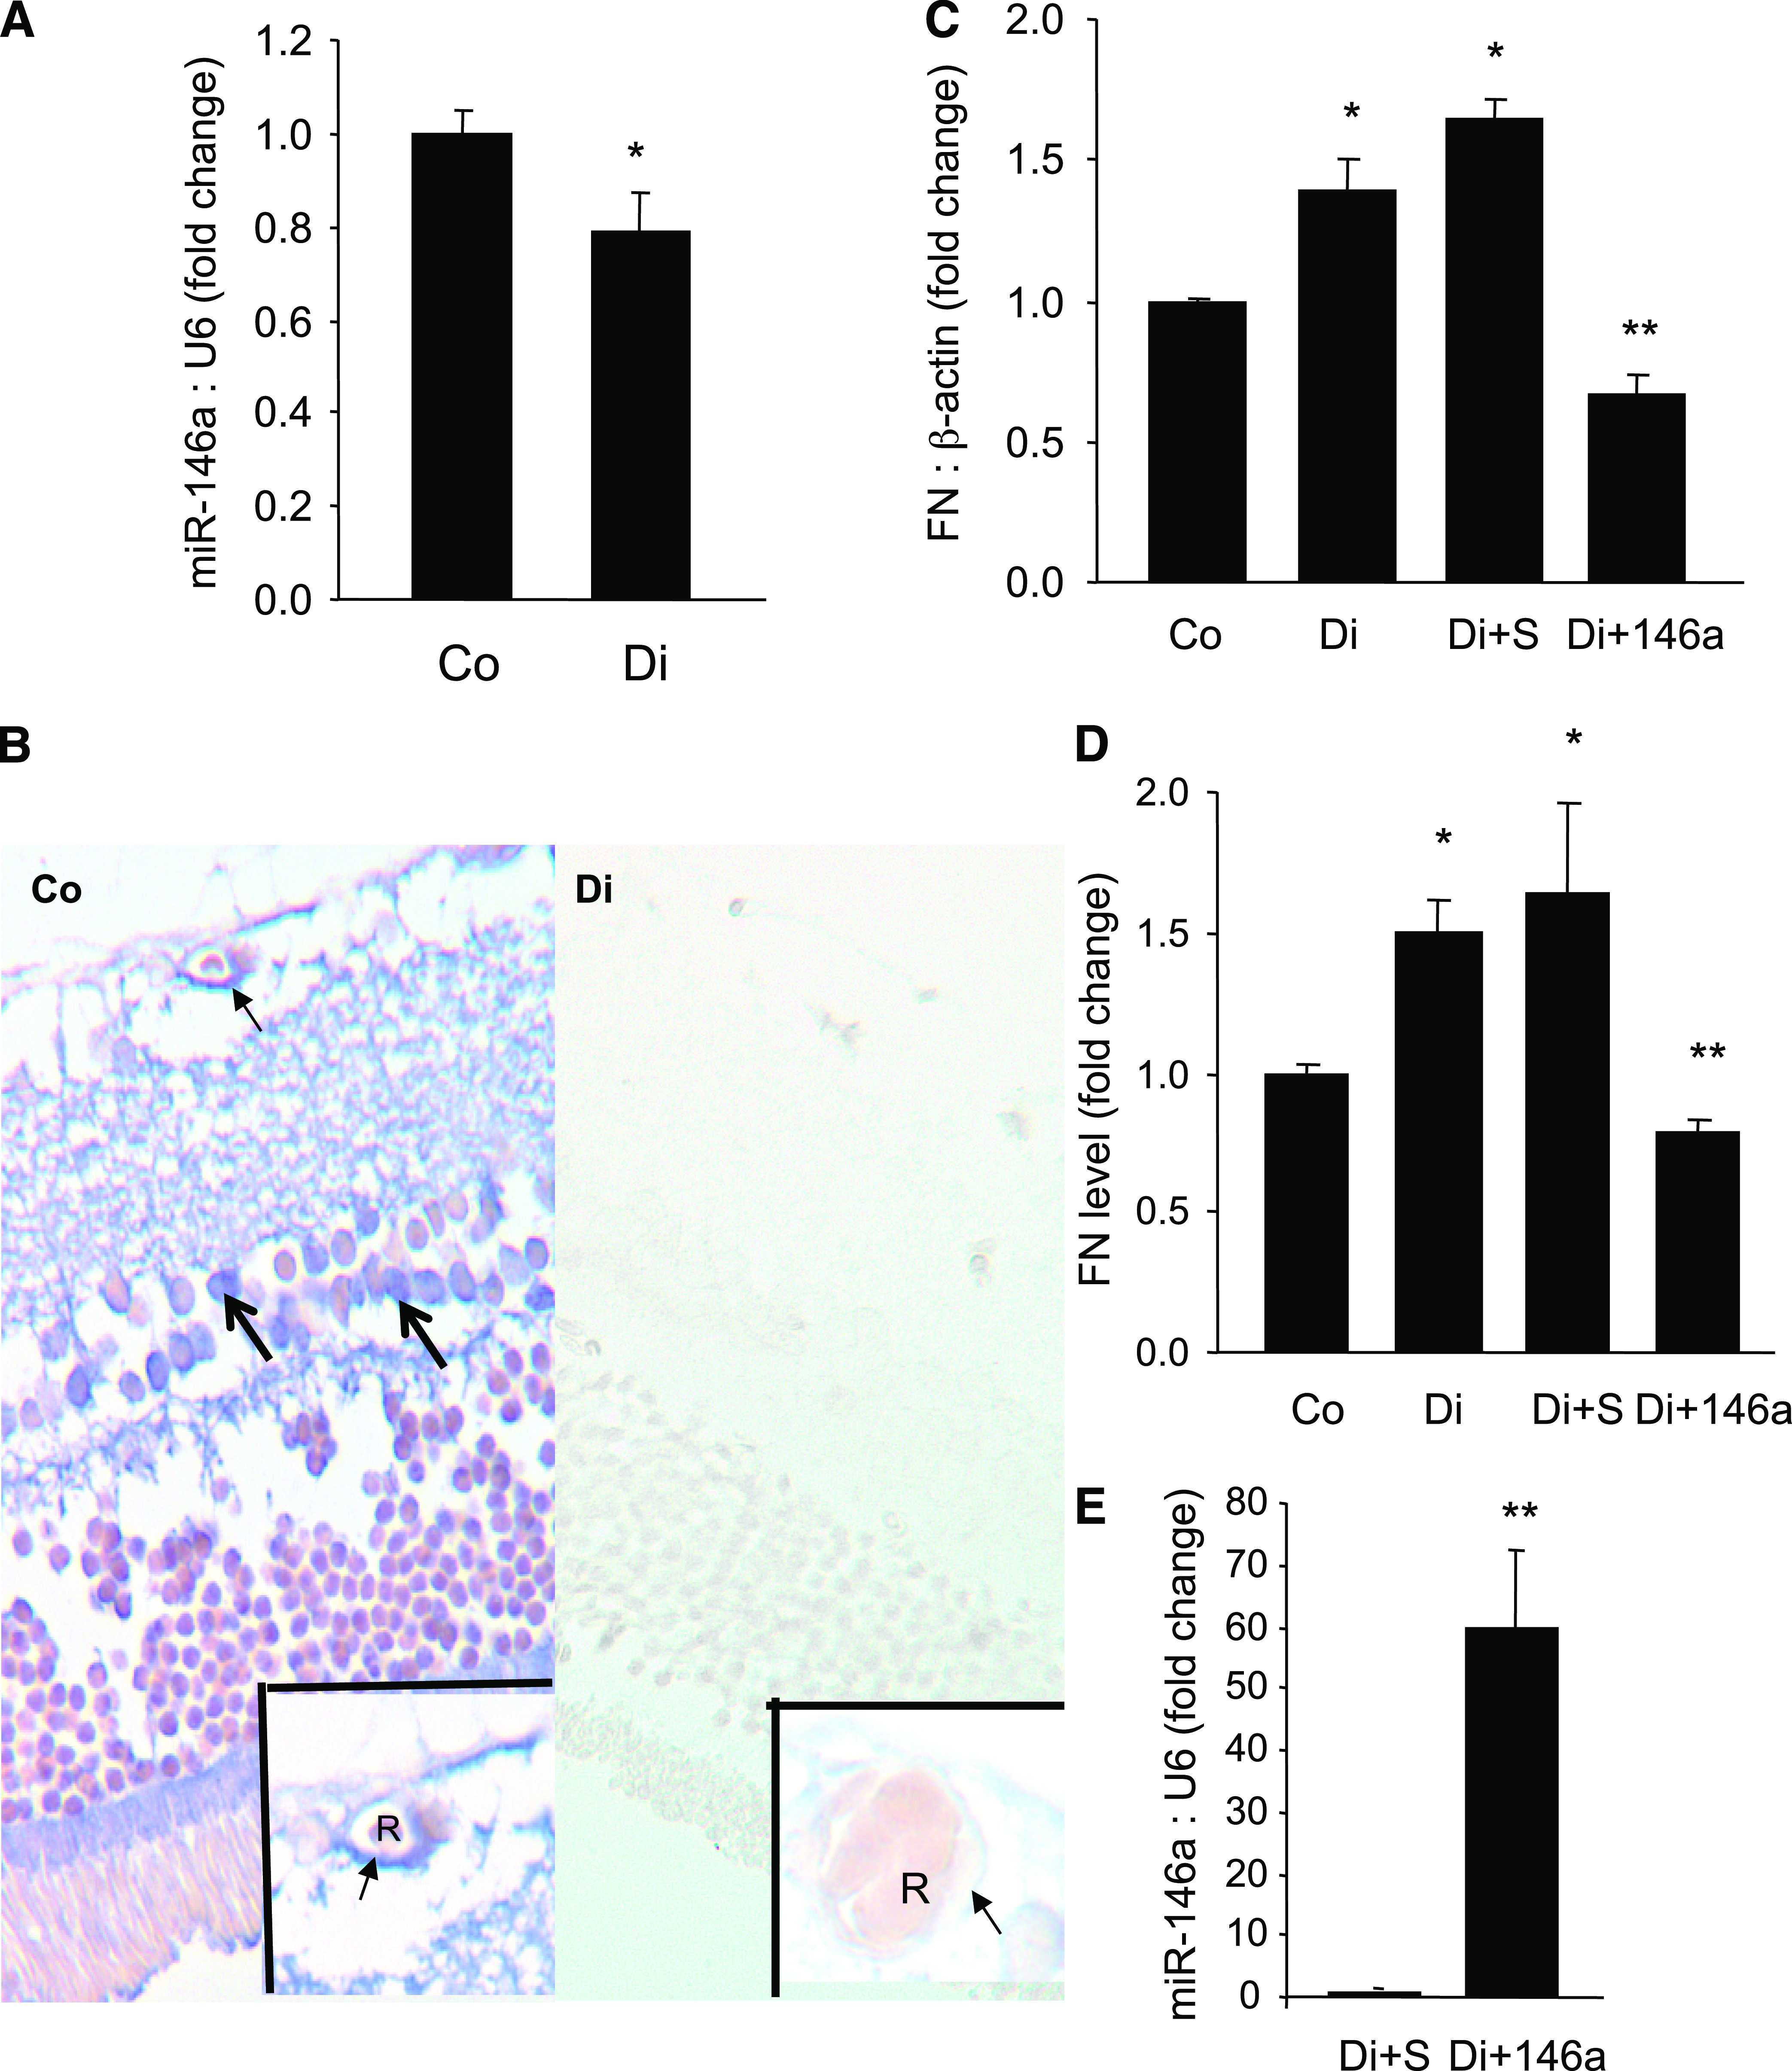
Research design and methods: miR-146a expressions were measured in endothelial cells from large vessels and retinal microvessels in various glucose levels. FN messenger RNA expression and protein levels with or without miR-146a mimic or antagomir transfection were examined. A luciferase assay was performed to detect miR-146a's binding to FN 3'-untranslated region (UTR). Likewise, retinas from type 1 diabetic rats were studied with or without an intravitreal injection of miR-146a mimic. In situ hybridization was used to localize retinal miR-146a. Cardiac and renal tissues were analyzed from type 1 and type 2 diabetic animals.

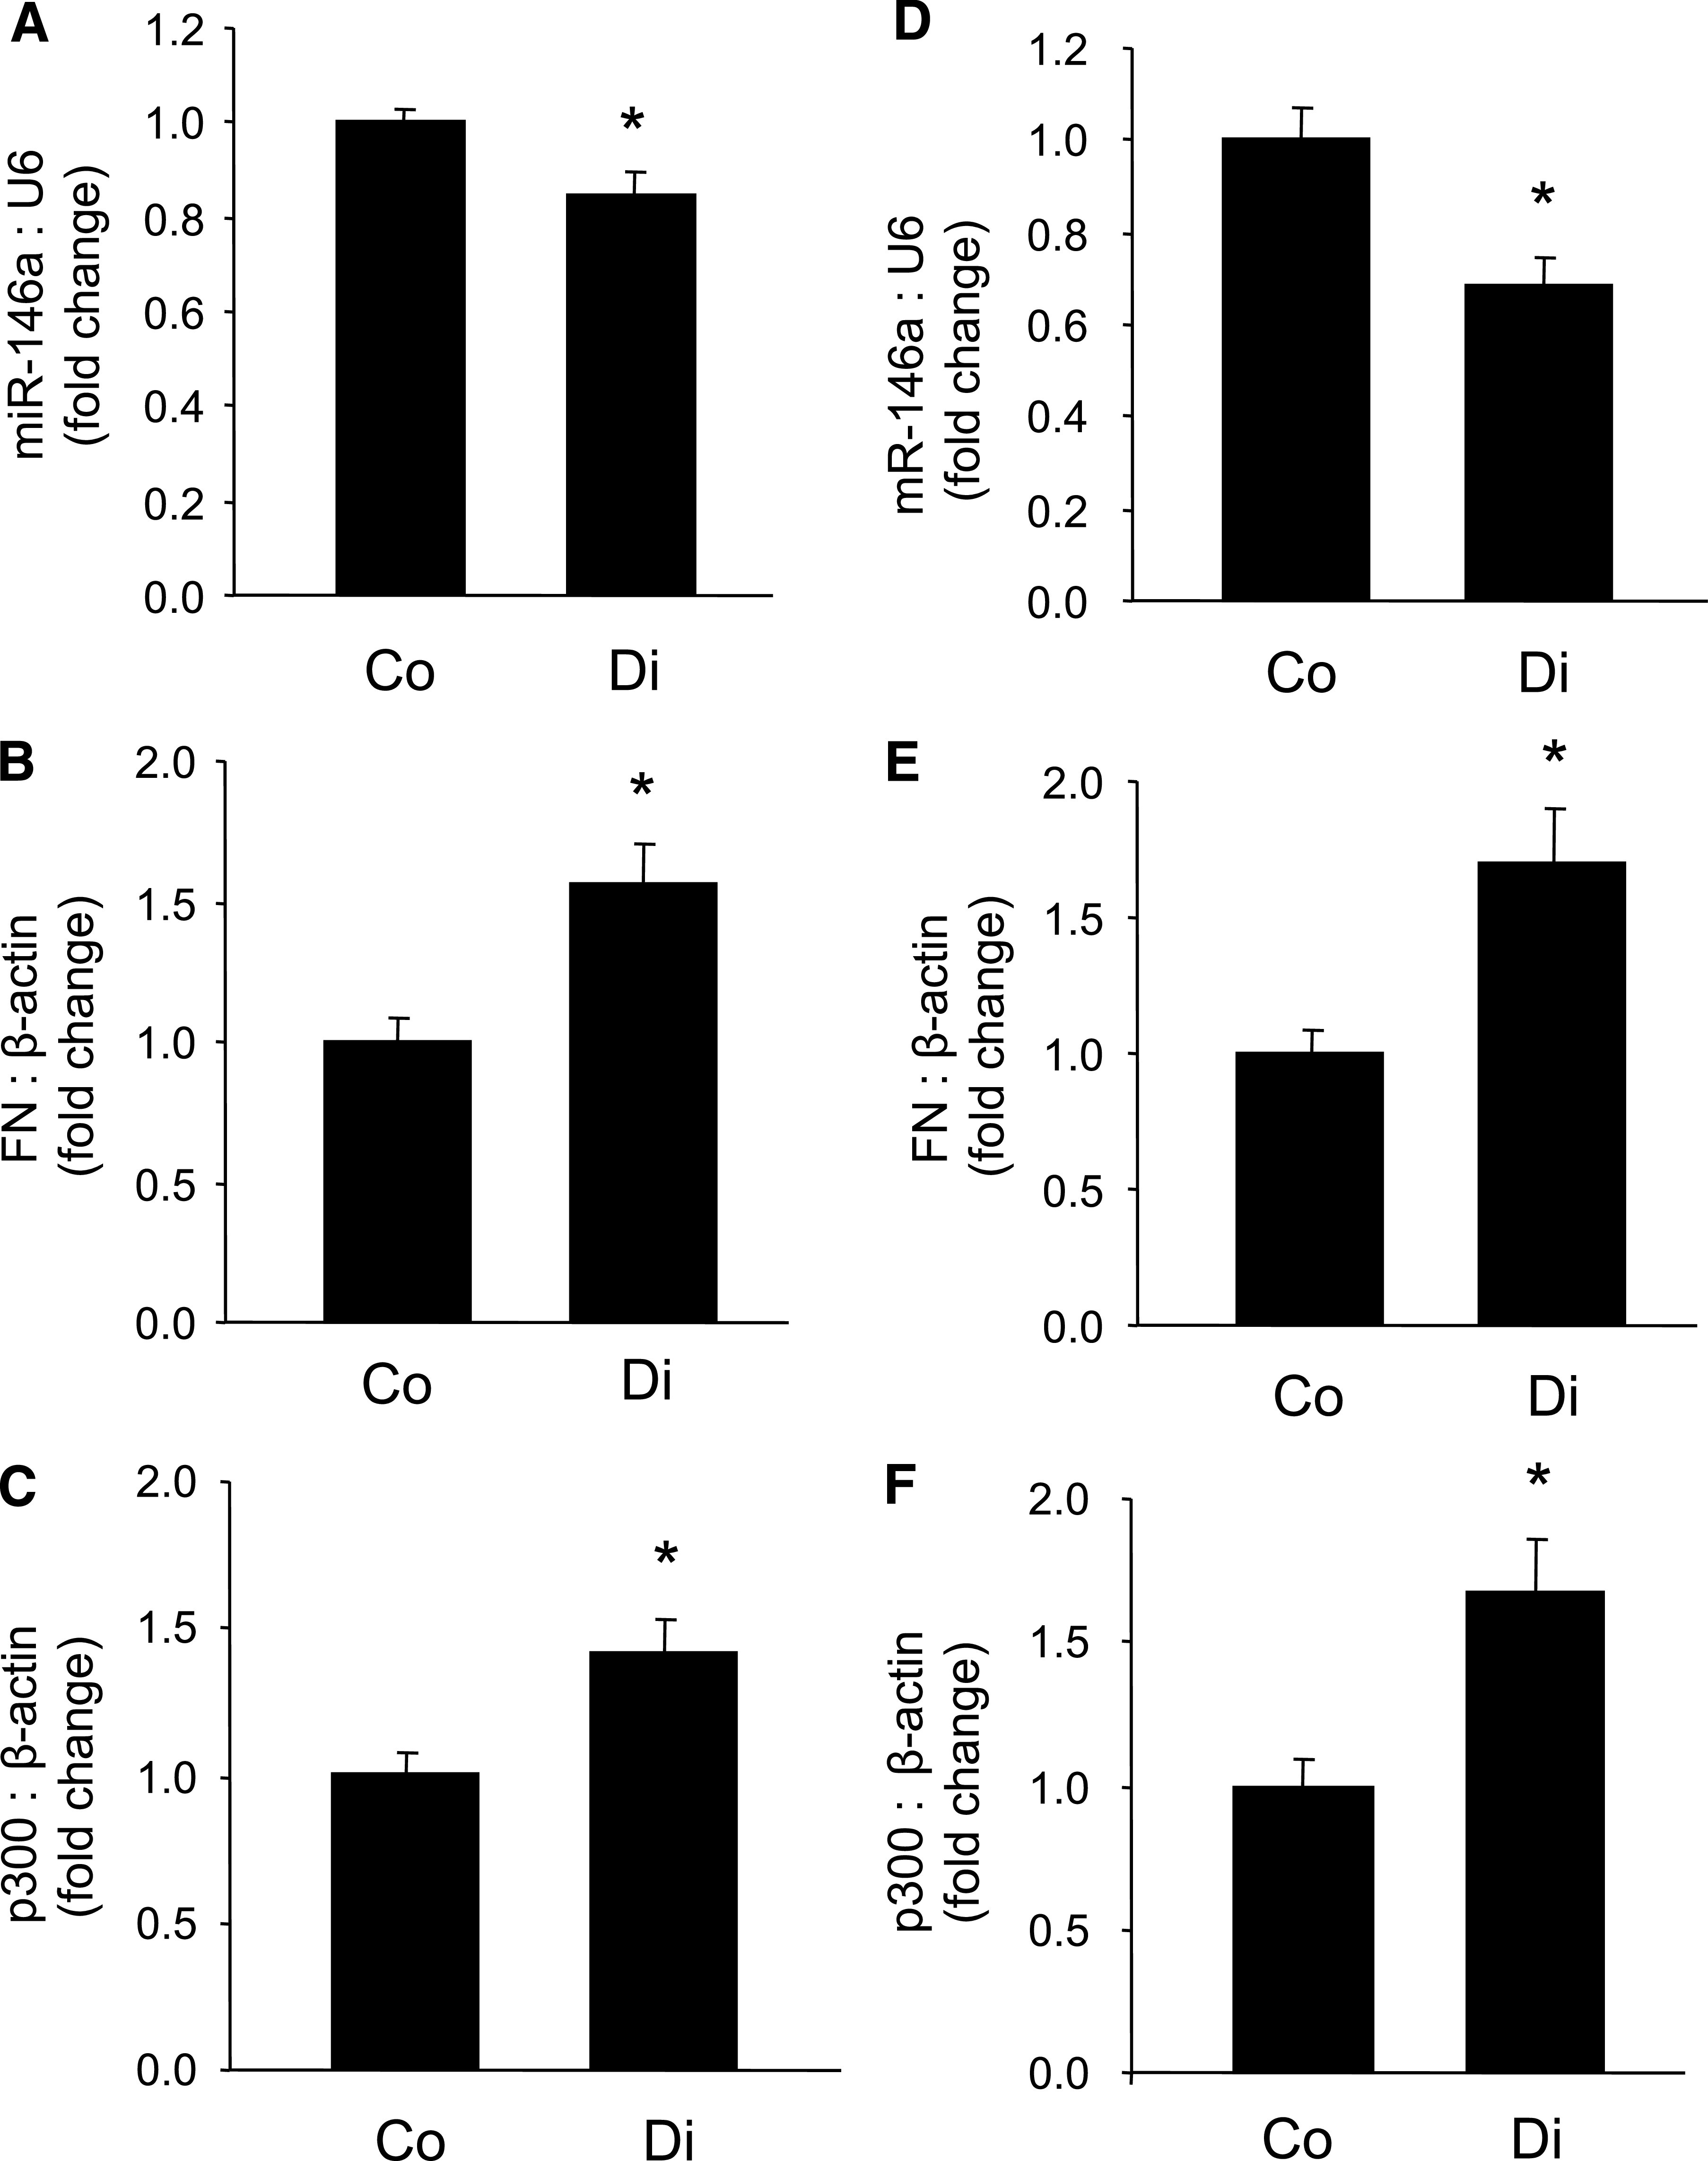
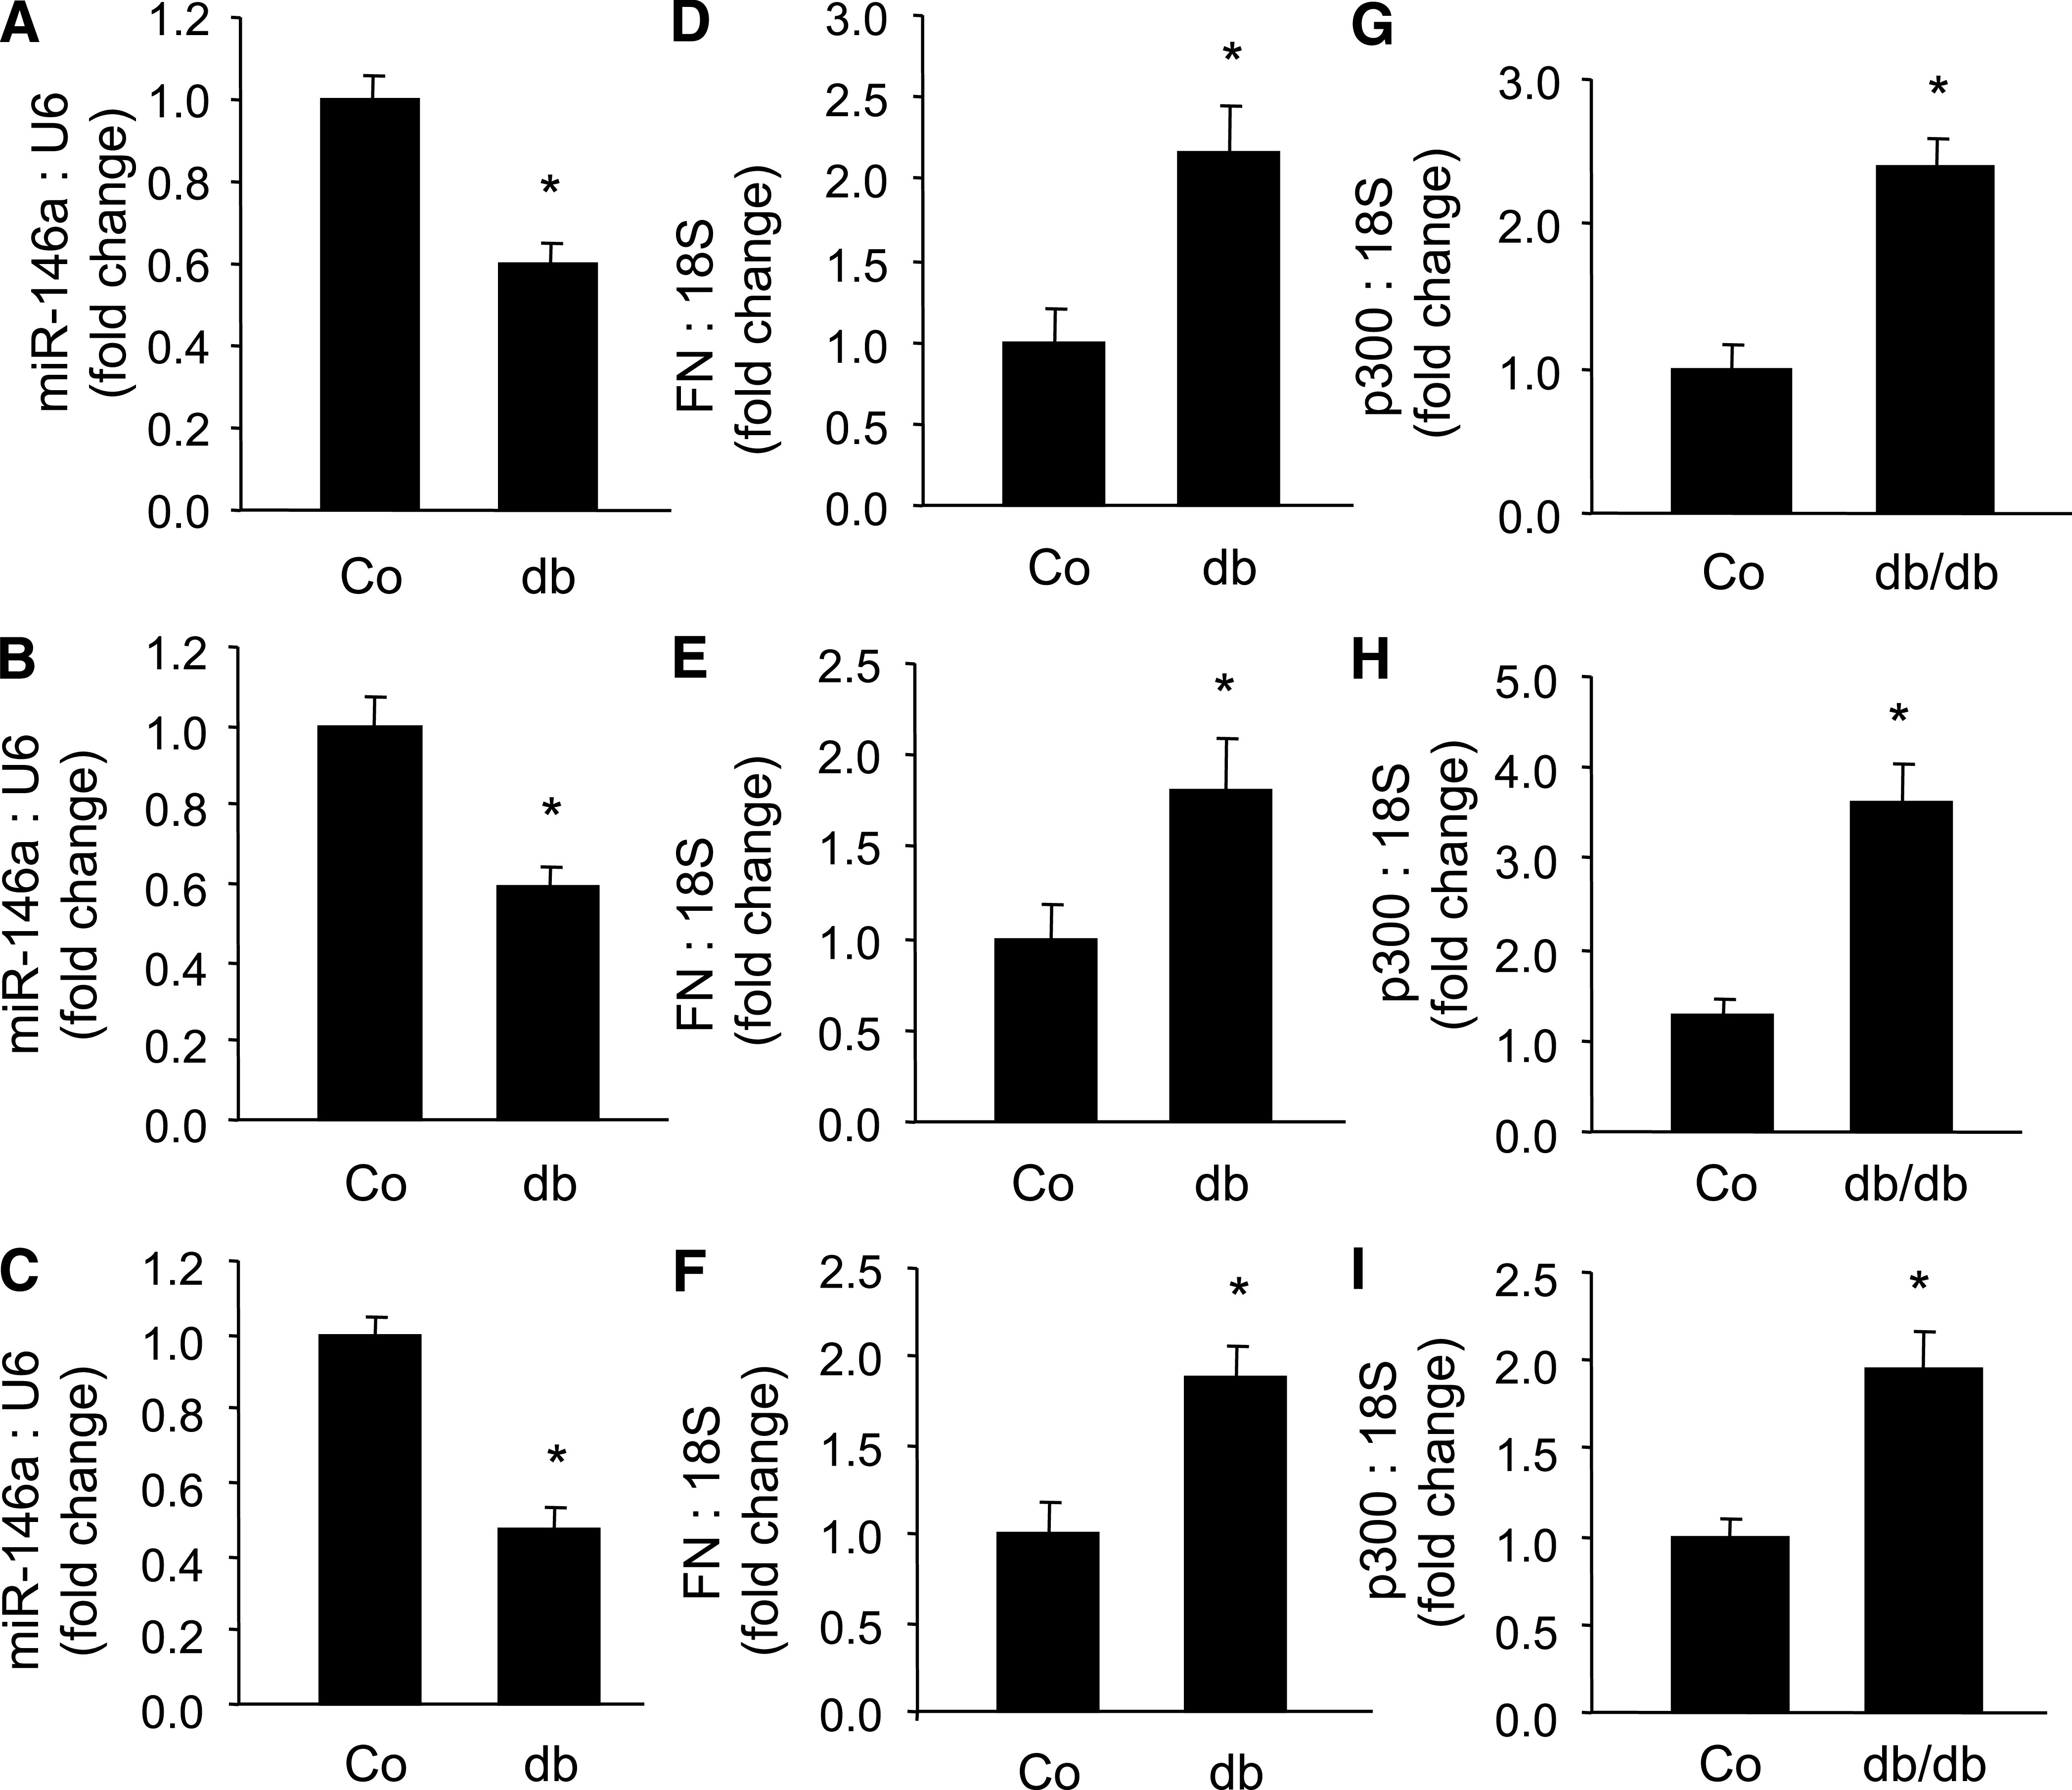
Results: A total of 25 mmol/L glucose decreased miR-146a expression and increased FN expression compared with 5 mmol/L glucose in both cell types. miR-146a mimic transfection prevented such change, whereas miR-146a antagomir transfection in the cells in 5 mmol/L glucose caused FN upregulation. A luciferase assay confirmed miR-146a's binding to FN 3'-UTR. miR-146a was localized in the retinal endothelial cells and was decreased in diabetes. Intravitreal miR-146a mimic injection restored retinal miR-146a and decreased FN in diabetes. Additional experiments showed that p300 regulates miR-146a. Similar changes were seen in the retinas, kidneys, and hearts in type 1 and type 2 diabetic animals.

Conclusions: These studies showed a novel, glucose-induced molecular mechanism in which miR-146a participates in the transcriptional circuitry regulating extracellular matrix protein production in diabetes.


Figures

FIG. 1.
FIG. 1.
Endothelial cells (HUVECs) exposed to 25 mmol/L (25 mM) glucose (compared with 5 mmol/L [5 mM] glucose) showed increased FN mRNA (A) and reduced miR-146a expression (B). Such changes were not seen when the cells were incubated with 25 mmol/L l-glucose (osmotic control [Osm]). Transfection of endothelial cells with miR-146a mimics (but not the scrambled mimics) reduced basal FN expression and normalized glucose-induced upregulation of FN mRNA (A) and FN protein (C). A: The glucose-like effect (FN upregulation) was further seen when cells in 5 mmol/L glucose were transfected with miR-146a antagomir. B: The efficiency of miR-146a mimic transfection by increased miR-146a expression following miR-146a mimic transfection compared with scrambled mimics. Likewise, BRMECs showed glucose-induced miR-146a downregulation (D) and FN upregulation (E). E: Transfection of BRMECs with miR-146a mimics reduced basal FN expression and also normalized HG-induced upregulation of FN mRNA. D: The efficiency of miR-146a mimic transfection by increased miR-146a expression following miR-146a mimic transfection compared with scrambled mimics. 146a, miR-146a mimic; 146a(A), miR-146a antagomir; S, scrambled miRNA. *Significantly different from 5 mmol/L glucose; **significantly different from 25 mmol/L glucose, miRNA levels are expressed as a ratio of RNU6B (U6); mRNA levels are expressed as a ratio to β-actin and normalized to 5 mmol/L glucose.
FIG. 2.
FIG. 2.
A: Alignment of FN 3′-UTR (and mutated FN 3′-UTR) sequence with mature miR-146a based on bioinformatics predictions (www.targetscan.org, www.microrna.org, and www.ebi.ac.uk1). The 5′ end of the mature miR-146a is the seed sequence and has perfect complementarity with seven nucleotides of the 3′-UTR of FN. In the mutated sequence (small caps identifying mutated nucleotides), such complementarity was lost. B and C: Luciferase reporter assay using rat and human FN, respectively, showing dose-dependent binding of FN 3′-UTR with miR-146a, whereas mutated (mut) FN 3′-UTR abrogated the inhibitory effects of miR-146a. Relative luciferase activities were expressed as luminescence units and normalized for β-galactosidase expression. **Significantly different from vector (V) or mut V, FN 3′-UTR luciferase plasmids plus β-galactosidase plasmids; V-mut, mutated FN 3′-UTR luciferase plasmids plus β-galactosidase plasmids. (A high-quality color representation of this figure is available in the online issue.)
FIG. 3.
FIG. 3.
miR-146a–mediated alteration of retinal FN. A: Poorly controlled diabetes caused a reduction of rat retinal miR-146a levels. B and C: Representative LNA-ISH study of retinal tissues in a control (Co) and a diabetic (Di) rat retina showing localization of miR-146a (blue chromogen) in the retinal capillaries (arrow) and in the cells of inner nuclear layer (large arrow), possibly both in the glial and neuronal elements. Insets show an enlarged view of the capillary with miR-146a localization (arrow) in a control rat and reduced level of endothelial miR-146a in the retina of a diabetic rat (arrow). Diabetes-induced augmented FN mRNA (C) and protein levels (D) (as measured by ELISA) in the rat retina can be prevented by intravitreal miR-146a mimic (but not by scrambled [S] mimics) injection. E: Efficiency of intravitreal delivery as demonstrated by increased retinal miR-146a expression after an intravitreal injection of miR-146a mimic compared with scrambled mimic. *Significantly different from control; **significantly different from diabetic or diabetic plus scrambled. miRNA levels are expressed as a ratio of RNU6B (U6) normalized to control or diabetic plus scrambled (E). mRNA levels are expressed as a ratio to β-actin and normalized to control. Alkaline phosphatase was used as chromogen (blue) with no counterstain in LNA-ISH. R, red blood cell. (A high-quality digital representation of this figure is available in the online issue.)
FIG. 4.
FIG. 4.
miR-146a levels are regulated with p300. In the endothelial cells, 25 mmol/L (25 mM) glucose-induced p300 mRNA upregulation (A) and increased histone acetylation (B) were prevented by p300 shRNA (p300sh) transfection. In the endothelial cells, p300 shRNA also prevented glucose-induced reduced miR-146a production (C) and FN mRNA (D) and FN protein upregulation (E) in the HUVECs. In parallel, diabetes-induced retinal p300 upregulation (G), miR-146a downregulation (H), and FN upregulation (I) were prevented by intravitreal p300 siRNA (p300si) injection. F: No significant differences were seen with respect to p300 mRNA expression when cells in 25 mmol/L glucose were transfected with miR-146a mimic or scrambled (S) mimic. *Significantly different from 5 mmol/L glucose or control (Co); **significantly different from 25 mmol/L glucose or diabetes (Di). miRNA levels are expressed as a ratio of RNU6B (U6); mRNA levels are expressed as a ratio to β-actin normalized to control or 5 mmol/L (5 mM) glucose.
FIG. 5.
FIG. 5.
In the heart (left column) and kidneys (right column) of type 1 diabetic (STZ induced) rats, miR-146a levels were reduced (A and D) and FN mRNA (B and E) and p300 mRNA (C and F) levels were elevated after 1 month of poorly controlled diabetes (Di). *Significantly different from control (Co), miRNA levels are expressed as a ratio of RNU6B (U6) normalized to control; mRNA levels are expressed as a ratio to β-actin normalized to control.
FIG. 6.
FIG. 6.
In the retina (upper row), heart (middle row), and kidneys (lower row) of type 2 diabetic (db/db) mice, miR-146a levels were reduced (AC) and FN mRNA (DF) and p300 mRNA (GI) levels were elevated after 2 months of poorly controlled diabetes (db). *Significantly different from control (Co), miRNA levels are expressed as a ratio of RNU6B (U6) normalized to control; mRNA levels are expressed as a ratio to β-actin normalized to control.

Similar articles

Cited by

References

    1. Chen S, Mukherjee S, Chakraborty C, Chakrabarti S. High glucose-induced, endothelin-dependent fibronectin synthesis is mediated via NF-kappa B and AP-1. Am J Physiol Cell Physiol 2003;284:C263–C272 - PubMed
    1. Chen S, Khan ZA, Cukiernik M, Chakrabarti S. Differential activation of NF-kappa B and AP-1 in increased fibronectin synthesis in target organs of diabetic complications. Am J Physiol Endocrinol Metab 2003;284:E1089–E1097 - PubMed
    1. Chen S, Feng B, George B, Chakrabarti R, Chen M, Chakrabarti S. Transcriptional coactivator p300 regulates glucose-induced gene expression in endothelial cells. Am J Physiol Endocrinol Metab 2010;298:E127–E137 - PubMed
    1. Roy S, Cagliero E, Lorenzi M. Fibronectin overexpression in retinal microvessels of patients with diabetes. Invest Ophthalmol Vis Sci 1996;37:258–266 - PubMed
    1. Xin X, Khan ZA, Chen S, Chakrabarti S. Extracellular signal-regulated kinase (ERK) in glucose-induced and endothelin-mediated fibronectin synthesis. Lab Invest 2004;84:1451–1459 - PubMed

Publication types

MeSH terms