. 2011 Aug 4;6(9):1290-307.
doi: 10.1038/nprot.2011.308.

Quantitative prediction of cellular metabolism with constraint-based models: the COBRA Toolbox v2.0

Affiliations

Quantitative prediction of cellular metabolism with constraint-based models: the COBRA Toolbox v2.0

Jan Schellenberger et al. Nat Protoc. .

Abstract

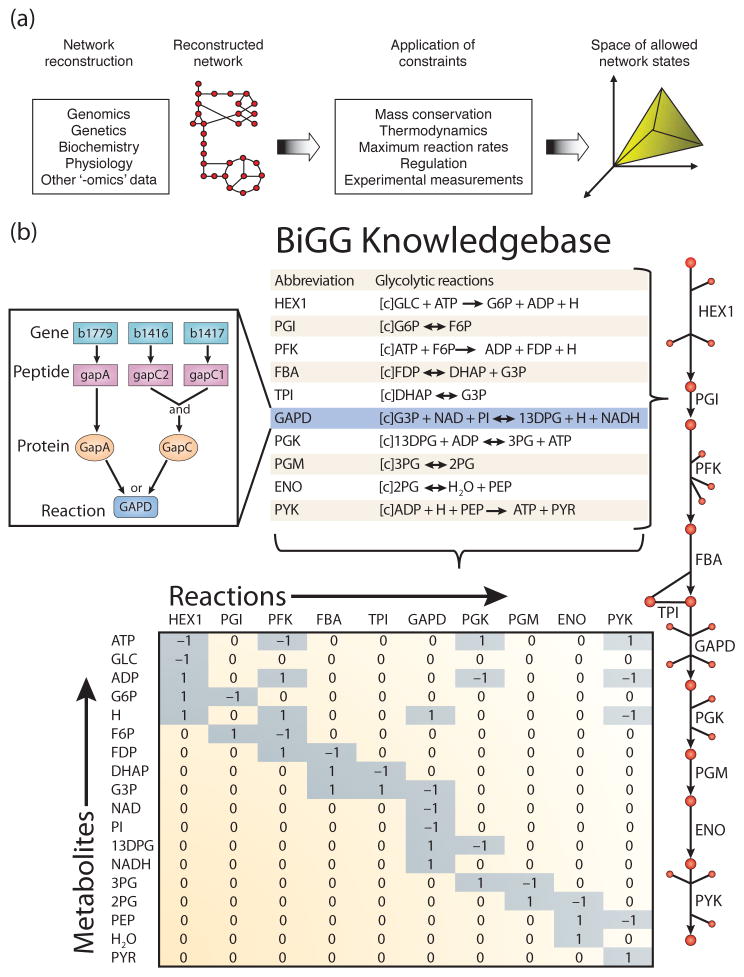
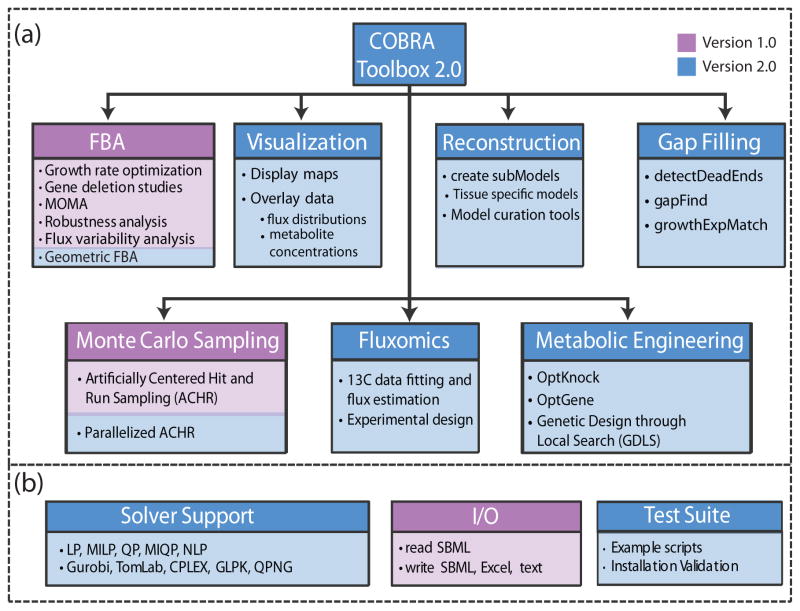
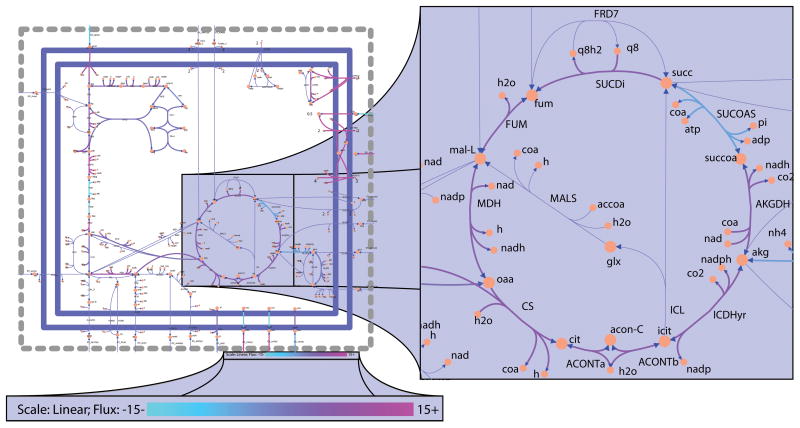
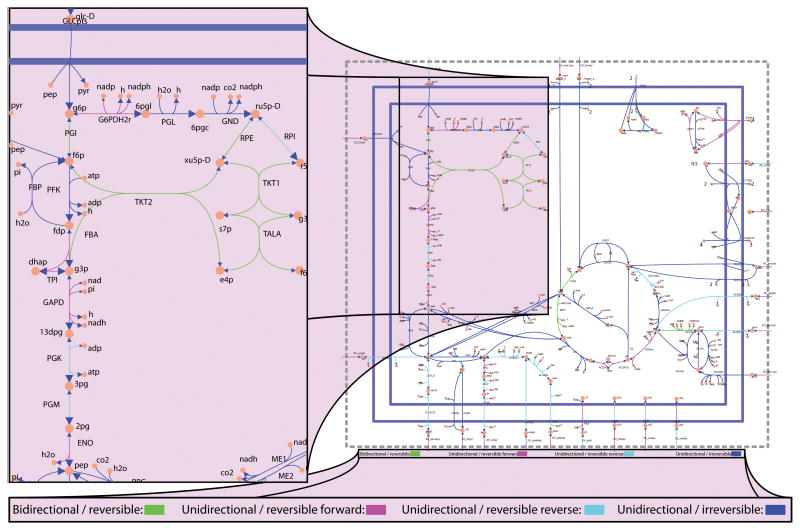
Over the past decade, a growing community of researchers has emerged around the use of constraint-based reconstruction and analysis (COBRA) methods to simulate, analyze and predict a variety of metabolic phenotypes using genome-scale models. The COBRA Toolbox, a MATLAB package for implementing COBRA methods, was presented earlier. Here we present a substantial update of this in silico toolbox. Version 2.0 of the COBRA Toolbox expands the scope of computations by including in silico analysis methods developed since its original release. New functions include (i) network gap filling, (ii) (13)C analysis, (iii) metabolic engineering, (iv) omics-guided analysis and (v) visualization. As with the first version, the COBRA Toolbox reads and writes systems biology markup language-formatted models. In version 2.0, we improved performance, usability and the level of documentation. A suite of test scripts can now be used to learn the core functionality of the toolbox and validate results. This toolbox lowers the barrier of entry to use powerful COBRA methods.


Conflict of interest statement

Competing Interests

Bernhard Ø. Palsson serves on the scientific advisory board of Genomatica, Inc.

Figures

Figure 1
Figure 1. The philosophy of COnstraints-Based Reconstruction and Analysis
(a) COnstraints-Based Reconstruction and Analysis (COBRA) of biological networks involves the creation of network models from a variety of biological data sources. The capabilities of the model are then assessed in the context of physical, chemical, regulatory, and omics constraints (Reproduced from Becker et al. with permission). (b) COBRA models are often derived from BiGG knowledgebases which are essentially 2-D annotations of the genome that relate metabolic activity to genomic loci. (left inset) In Escherichia coli, the glyceraldehyde-3-phosphate dehydrogenase (GAPD) activity can be provided by two isozymes (GapA or GapC); GapC is a heteromeric protein that requires genes from two genomic loci. The contents of a BiGG knowledgebase can be converted to a map (right) to facilitate visual interpretation. Or a mathematical modeling formalism to develop and explore hypotheses, such as a stoichiometric matrix (bottom) that can be used to explore mass flow through the network. (Modified reproduction from Reed et al. with permission).
Figure 2
Figure 2. Overview of the COBRA toolbox
(a) Seven categories of COBRA methods contained within version 2.0 of the COBRA Toolbox. (b) The COBRA Toolbox contains solver interface functions for linear, quadratic, mixed integer linear and quadratic, and nonlinear programming problems. Functions to read and write models in several formats are available. A test suite is included to validate installation as well as provide example implementation of many methods.
Figure 3
Figure 3. Flux balance analysis of E. coli core model
(left) Full E. coli core map. (right) Zoom in on the optimal flux distribution map of the citric acid cycle. (bottom) Zoom in on the flux color scale. Reactions are colored according to a scale of cyan (flux of 15 mmol · gDW−1 · h−1 or greater in the reverse direction) to magenta (flux of 15 mmol · gDW−1 · h−1 or greater in the forward direction). Reactions carrying zero flux have their corresponding arrows narrowed.
Figure 4
Figure 4. Flux variability analysis of E. coli
(right) Reaction map of E. coli core model. (left) Flux variability analysis of part of glycolysis and pentose phosphate pathway in the E. coli core model when growth rate is constrained to 90% of optimal. Bi-directional reversible reactions are colored green. Unidirectional reversible reactions which carry flux in the forward direction are colored magenta. Unidirectional reversible reactions which carry flux only in the reverse direction are colored cyan. Irreversible fluxes are colored blue. Unidirectional fluxes have enlarged arrowheads in the direction of the flux.
Figure 5
Figure 5. Sampling histogram of glycolysis using the E. coli core model under aerobic and anaerobic glucose minimal media conditions
For growth in aerobic () vs. anaerobic () medium, there is a large shift in the probable flux through many of the reactionsIn general, the range of flux probabilities for each reaction became more constrained. Phosphoglucose Isomerase (PGI) switched from being able to carry flux in either direction with aerobic conditions to only carrying flux in the forward direction with anaerobic conditions.

References

    1. Feist AM, et al. Model-driven evaluation of the production potential for growth-coupled products of Escherichia coli. Metab Eng. 2010;12:173–86. - PMC - PubMed
    1. Feist AM, Palsson BO. The growing scope of applications of genome-scale metabolic reconstructions using Escherichia coli. Nat Biotechnol. 2008;26:659–67. - PMC - PubMed
    1. Oberhardt MA, Palsson BO, Papin JA. Applications of genome-scale metabolic reconstructions. Mol Syst Biol. 2009;5:320. - PMC - PubMed
    1. Covert MW, Knight EM, Reed JL, Herrgard MJ, Palsson BO. Integrating high-throughput and computational data elucidates bacterial networks. Nature. 2004;429:92–96. - PubMed
    1. Gianchandani EP, Joyce AR, Palsson BO, Papin JA. Functional states of the genome-scale Escherichia coli transcriptional regulatory system. PLoS Comput Biol. 2009;5:e1000403. - PMC - PubMed

Publication types