. 2011 Aug 12:5:98.
doi: 10.3389/fnins.2011.00098. eCollection 2011.

Genome-Wide Gene Expression Profiling of Nucleus Accumbens Neurons Projecting to Ventral Pallidum Using both Microarray and Transcriptome Sequencing

Affiliations

Genome-Wide Gene Expression Profiling of Nucleus Accumbens Neurons Projecting to Ventral Pallidum Using both Microarray and Transcriptome Sequencing

Hao Chen et al. Front Neurosci. .

Abstract

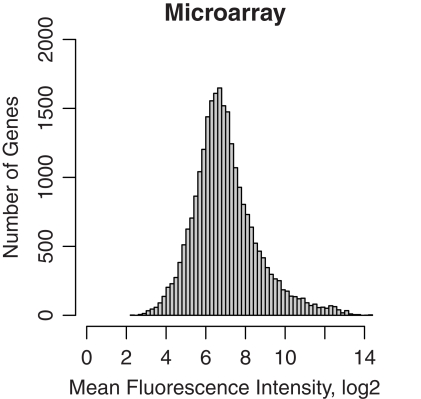
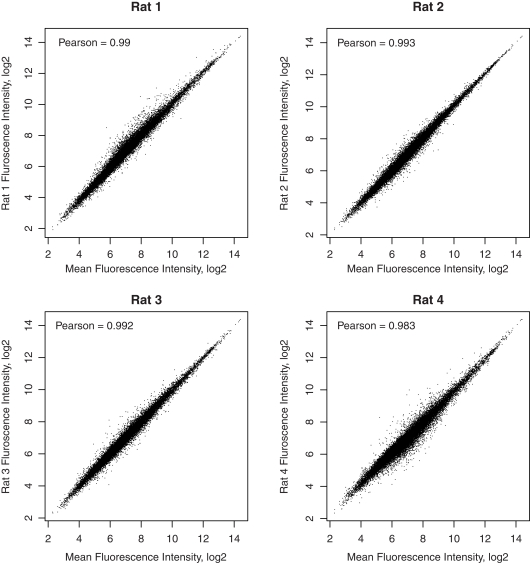
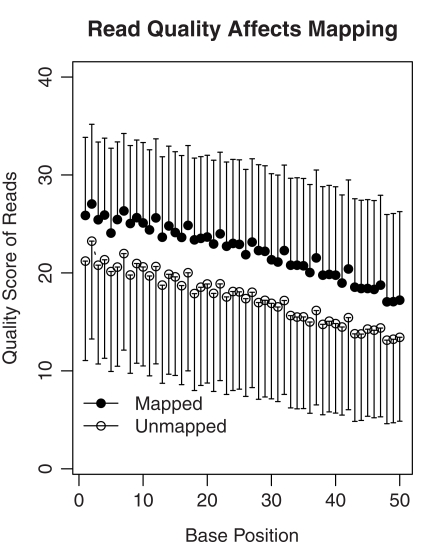
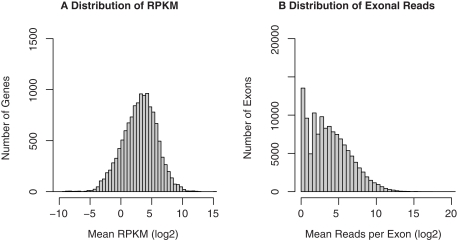
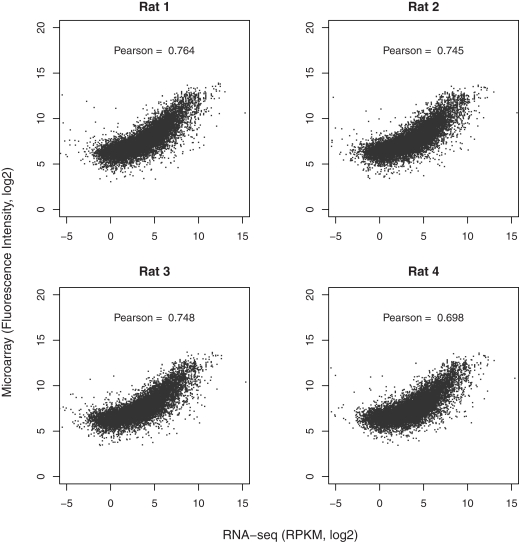
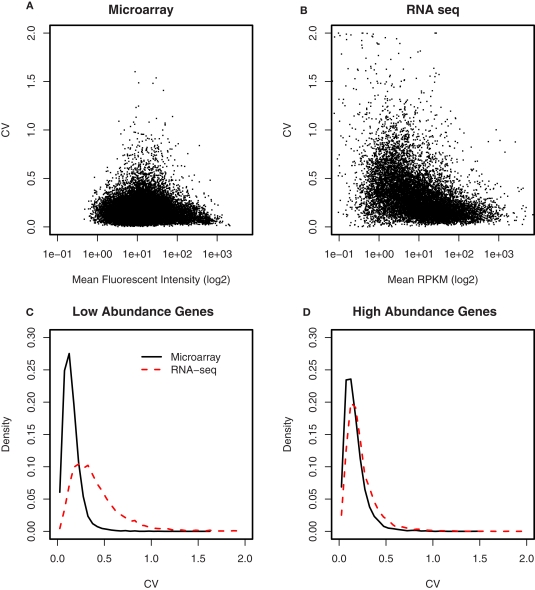
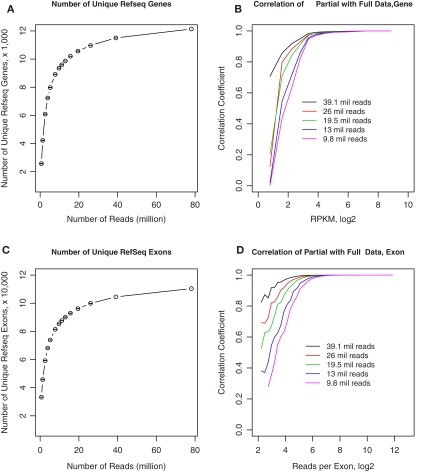
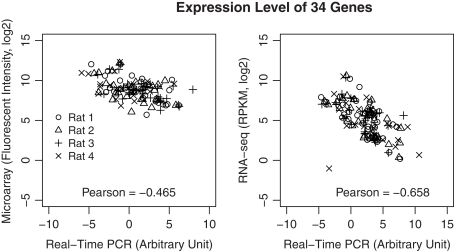
The cellular heterogeneity of brain poses a particularly thorny issue in genome-wide gene expression studies. Because laser capture microdissection (LCM) enables the precise extraction of a small area of tissue, we combined LCM with neuronal track tracing to collect nucleus accumbens shell neurons that project to ventral pallidum, which are of particular interest in the study of reward and addiction. Four independent biological samples of accumbens projection neurons were obtained. Approximately 500 pg of total RNA from each sample was then amplified linearly and subjected to Affymetrix microarray and Applied Biosystems sequencing by oligonucleotide ligation and detection (SOLiD) transcriptome sequencing (RNA-seq). A total of 375 million 50-bp reads were obtained from RNA-seq. Approximately 57% of these reads were mapped to the rat reference genome (Baylor 3.4/rn4). Approximately 11,000 unique RefSeq genes and 100,000 unique exons were identified from each sample. Of the unmapped reads, the quality scores were 4.74 ± 0.42 lower than the mapped reads. When RNA-seq and microarray data from the same samples were compared, Pearson correlations were between 0.764 and 0.798. The variances in data obtained for the four samples by microarray and RNA-seq were similar for medium to high abundance genes, but less among low abundance genes detected by microarray. Analysis of 34 genes by real-time polymerase chain reaction showed higher correlation with RNA-seq (0.66) than with microarray (0.46). Further analysis showed 20-30 million 50-bp reads are sufficient to provide estimates of gene expression levels comparable to those produced by microarray. In summary, this study showed that picogram quantities of total RNA obtained by LCM of ∼700 individual neurons is sufficient to take advantage of the benefits provided by the transcriptome sequencing technology, such as low background noise, high dynamic range, and high precision.

Keywords: GABA; GABAergic; RNA sequencing; laser capture microdissection; microarray; nucleus accumbens; transcriptome sequencing.


Figures

Figure 1
Figure 1
Microarray gene expression profiles of GABAergic neurons projecting from nucleus accumbens shell to ventral pallidum. These projection neurons were labeled retrogradely by Fluorogold and were obtained by laser capture microdissection. RNA were extracted and amplified before hybridization to Affymetrix rat ST 1.0 microarrays. Background noise, estimated using the antigenomic controls, were subtracted and signals were normalized using the Bioconductor xps package. The distribution of mean microarray signal intensities for all gene transcripts detected in four rat samples from nucleus accumbens of inbred Lewis rats were plotted. The median fluorescence signal intensity was 6.78. Thus, LCM samples provided sufficient RNA for amplification and reliable detection of the transcriptome.
Figure 2
Figure 2
Correlation of each microarray sample with the mean of all samples. The correlation coefficients between the gene expression levels in each rat and the mean expression levels of the four rats are reported in the respective graphs. The high correlations demonstrated the reliability of detection of microarays.
Figure 3
Figure 3
The quality of sequencing reads affects mapping. A total of 78 million 50-bp reads were obtained for rat 1. Among them, 35.8 million reads were mapped to the genome or known splicing sites. The mean quality scores of the mapped vs the unmapped reads were plotted. In general, the quality scores declined over the sequencing runs (i.e., from base 1 to 50). On average, the unmapped reads had quality scores 4.74 ± 0.42 lower than those that were mapped. Thus, lower quality of the read data is likely one of the reasons many reads are not mappable.
Figure 4
Figure 4
RNA-seq gene expression profiles of GABAergic neurons projecting from nucleus accumbens shell to ventral pallidum. The same RNA samples used in the microarray study were amplified before “bar-coded” cDNA libraries were prepared for SOLiD sequencing. All four samples were then pooled and sequenced in the same run. The 50-bp sequencing reads were mapped to the rat reference genome and known splicing sites using the SHRiMP and TopHat programs, respectively. Gene expression levels (normalized to RPKM) were obtained using the Cufflinks program. A total of 11,000 unique RefSeq genes and 100,000 unique exons were detected. The distribution of mean RPKM for these genes (A) and exons (B) was plotted.
Figure 5
Figure 5
Correlation of each RNA-seq sample with the mean of all samples. The correlation coefficients between the gene expression levels from each rat and the mean expression levels of the four rats are reported in their respective graphs. The high correlation demonstrated the reliability of detection of RNA-seq.
Figure 6
Figure 6
Comparison of microarray with RNA-seq data. The gene expression levels obtained from microarray and RNA-seq for each rat were matched based on RefSeq IDs. Over 11,000 genes were detected by both techniques. The correlation coefficients were provided in the respective graphs. In general, genes expressed at higher abundance tend to be better correlated than those expressed at lower abundance levels. More importantly, the dynamic range of RNA-seq is much higher than that of microarray (from −4 to 10 vs from 5 to 15 on log2 scale for RNA-seq and microarray, respectively, representing ∼2–3 orders of magnitude in difference). This enhanced dynamic range is likely to provide better accuracy in detecting the differences between samples or treatments.
Figure 7
Figure 7
Comparison of the variances between microarray and RNA-seq. (A) The coefficient of variation for each gene was plotted against its signal intensity obtained from microarray. (B) The coefficient of variation for each gene was plotted against its signal intensity obtained from RNA-seq. (C) The distribution of the CVs for low abundance genes showed microarray has less genes with high CVs (e.g., greater than 0.2) than RNA-seq. (D) The distribution of the CVs for high abundance genes were similar between microarray and RNA-seq. These data suggest that the samples size of RNA-seq experiments need to be the same or larger (for low abundance genes) than those of microarray experiments.
Figure 8
Figure 8
Effect of sequencing depth on RNA-seq data quality. (A) We obtained 78 million 50-bp reads from rat 1. Different numbers of reads were randomly sampled from the full data set of 78 million reads. The number of unique RefSeq genes was calculated from the full and randomly sampled subsets. The total number of unique genes remained stable when greater than 9.8 million reads were analyzed. (B) Gene expression levels calculated from these randomly selected subsets were highly correlated with the full data set when RPKM is above ∼23, despite gradual decreasing the number of reads to 9.8 million. (C) The number of unique exons detected were calculated for the entire and randomly sampled subsets. The total number of exons remained stable when greater than 9.8 million reads were analyzed. (D) The number of reads for each exon obtained from the randomly sampled data sets were correlated to the entire data set. The correlation for exons with more than ∼25 reads was greater than 0.9 despite the decrease in reads to 9.8 million. At 19.5 million reads, exons with ∼8 reads still had correlation of ∼0.7 with values obtained from the entire data set. These results suggest that ∼15–20 million reads are sufficient to generate estimates of gene expression levels that are similar to those obtained from 70 to 80 million reads.
Figure 9
Figure 9
Validation of gene expression data using real-time PCR. A total of 34 genes were selected across a wide dynamic range. Real-time PCR was performed using the amplified cDNA from each of the microarray and RNA-seq samples. The correlations of the expression levels of these genes measured using real-time PCR and the respective microarray or RNA-seq measures were highly significant (p < 8.1E-08 and p > 4.4E-16, respectively). However, the overall correlation is higher for RNA-seq than microarray, suggesting data from RNA-seq is likely to be more accurate than those obtained from microarray.

References

    1. Bradford J. R., Hey Y., Yates T., Li Y., Pepper S. D., Miller C. J. (2010). A comparison of massively parallel nucleotide sequencing with oligonucleotide microarrays for global transcription profiling. BMC Genomics 11, 282. 10.1186/1471-2164-11-282 - DOI - PMC - PubMed
    1. Costa V., Angelini C., De Feis I., Ciccodicola A. (2010). Uncovering the complexity of transcriptomes with RNA-Seq. J. Biomed. Biotechnol. 2010, 853916. 10.1155/2010/853916 - DOI - PMC - PubMed
    1. David M., Dzamba M., Lister D., Ilie L., Brudno M. (2011). SHRiMP2: sensitive yet practical SHort Read Mapping. Bioinformatics 27, 1011–1012 10.1093/bioinformatics/btr046 - DOI - PubMed
    1. El Mestikawy S., Wallen-Mackenzie A., Fortin G. M., Descarries L., Trudeau L. E. (2011). From glutamate co-release to vesicular synergy: vesicular glutamate transporters. Nat. Rev. Neurosci. 12, 204–216 10.1038/nrn2969 - DOI - PubMed
    1. Gentleman R. C., Carey V. J., Bates D. M., Bolstad B., Dettling M., Dudoit S., Ellis B., Gautier L., Ge Y., Gentry J., Hornik K., Hothorn T., Huber W., Iacus S., Irizarry R., Leisch F., Li C., Maechler M., Rossini A. J., Sawitzki G., Smith C., Smyth G., Tierney L., Yang J. Y., Zhang J. (2004). Bioconductor: open software development for computational biology and bioinformatics. Genome Biol. 5, R80. 10.1186/gb-2004-5-10-r80 - DOI - PMC - PubMed

LinkOut - more resources