. 2011 Aug 3:5:75.
doi: 10.3389/fnhum.2011.00075. eCollection 2011.

Value and prediction error in medial frontal cortex: integrating the single-unit and systems levels of analysis

Affiliations

Value and prediction error in medial frontal cortex: integrating the single-unit and systems levels of analysis

Massimo Silvetti et al. Front Hum Neurosci. .

Abstract

The role of the anterior cingulate cortex (ACC) in cognition has been extensively investigated with several techniques, including single-unit recordings in rodents and monkeys and EEG and fMRI in humans. This has generated a rich set of data and points of view. Important theoretical functions proposed for ACC are value estimation, error detection, error-likelihood estimation, conflict monitoring, and estimation of reward volatility. A unified view is lacking at this time, however. Here we propose that online value estimation could be the key function underlying these diverse data. This is instantiated in the reward value and prediction model (RVPM). The model contains units coding for the value of cues (stimuli or actions) and units coding for the differences between such values and the actual reward (prediction errors). We exposed the model to typical experimental paradigms from single-unit, EEG, and fMRI research to compare its overall behavior with the data from these studies. The model reproduced the ACC behavior of previous single-unit, EEG, and fMRI studies on reward processing, error processing, conflict monitoring, error-likelihood estimation, and volatility estimation, unifying the interpretations of the role performed by the ACC in some aspects of cognition.

Keywords: ACC; conflict monitoring; dopamine; error likelihood; reinforcement learning; reward; volatility.


Figures

Figure 1
Figure 1
(A) Model structure with equations describing both model dynamics and learning process (see also Methods of Simulation 1 and Appendix). Model structure: V, reward prediction unit; δ+ and δ, positive and negative prediction error units; C1 and C2, units coding for events; TSN, temporally shifting neuron; RW, unit generating reward signal. Model dynamics and learning: α, γ, and ζ are parameters. Equation f1.1 describes weights dynamics, w, weights vector; C, cue units’ output vector; V, prediction unit output; δ+, δ, output of prediction error units (positive and negative). Equations f1.2–f1.5 describe model dynamics: the symbol x ’ indicates first derivative, while [x]+ indicates the rectification max(0, x); RW, reward signal; TSN, temporally shifting neuron output. (B) Simulation 1: ACC neurophysiology. Model behavior during Pavlovian conditioning of two different stimuli, one rewarded 87% (left column) and the other 33% (right column). All plots are stimulus onset-locked, time scale in ms, signal amplitudes are in arbitrary units. Red plots: activity during the first trials of training; blue plots: activity recorded after several tens of trials (see Methods). After some tens of trials (blue plots), the response of the V unit (first row) to stimuli became proportional to the reward rate. Prediction error units (second and third row) showed, during reward periods (indicated by black bars on the top), responses proportional to the discrepancy between the expectation (V unit activity) and the actual outcome (RW signal). (C) Left: behavior of the TSN unit during three different training periods (early, middle, and late training). It exhibits temporal shifting of its response from the reward period to the cue period. Right: activity of the TSN unit during unrewarded trials, exhibiting a depression of its baseline activity (arrow) at the time when reward is expected.
Figure 2
Figure 2
Simulation 2: error processing. Model global activity (sum of all the three units of the model) during the reward period. All the plots are feedback onset-locked, time scale in milliseconds. As noted in the text, feedback can be either internally generated (ERN, feedback onset close to response) or external (FRN). The two plots show the crossover of response amplitude for correct or incorrect trials as a function of the reward expectation (87 or 33%), resembling the ERN wave behavior in humans.
Figure 3
Figure 3
Simulation 3: conflict monitoring. Response amplitude for congruent (CO) and incongruent trials (IN) in two experimental paradigms. All the plots are feedback onset-locked, time scale in ms. (A) Simulation with RTs and error rates as in the fMRI study of Van Veen and Carter (2005). The ACC module of the RVPM showed a higher activation for incongruent than congruent correct trials (incongruent > congruent, left plot), but a crossover of response (congruent > incongruent) for error trials (right plot). (B) Simulation with RTs and error rates resembling the ERP study of Scheffers and Coles (2000). Coherently with the ERP findings, the model did not show a difference between the congruent and incongruent condition in correct trials (left), but it showed a higher activity for congruent than incongruent error trials.
Figure 4
Figure 4
Simulation 4: error-likelihood estimation. Plots are feedback onset-locked, time scale in ms. HCh, high-error-likelihood incongruent trials; LCh, low-error-likelihood incongruent trials; HGo, high-error-likelihood congruent trials; LGo, low-error-likelihood congruent trials. For correct trials, the model showed a higher activity for high-error-likelihood than for low-error-likelihood trials (both Change and Go trials; left plot), but a reverse effect for error trials (right plot).
Figure 5
Figure 5
Simulation 5: volatility. Plots are reward onset-locked, time scale in ms (A) Model response during feedback periods in volatile and stationary environments. All the plots are feedback onset-locked, timescale in milliseconds. Stat, stationary condition; Vol, volatile condition. The model showed a higher activity in a volatile environment than in a stationary environment for both rewarded (left plot) and unrewarded (right plot) trials. (B) Variation rate of the weights (black plot) connecting the C units to the V unit, as a function of trial number. In the first epoch, the model was exposed to a Stationary environment (constant reward rates, red and blue lines indicating the reward rates of two different cues). During the second epoch, the environment became volatile (reward rate switching between red and blue), and the δ units started to re-map the associations between cues and reward rates, thus increasing the weights variation rates. The two hills in the volatile epoch correspond to the two reward rate switches.
Figure A1
Figure A1
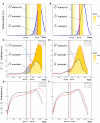
Interaction between RTs and δ unit activity in the two experiments of Simulation 3 (Conflict monitoring). First row (A) illustrative plot showing a situation with a large difference in average RTs between congruent and incongruent trials (like in Van Veen et al., 2001). The black line illustrates the response time of a typical congruent (CO) trial; the red line illustrates the response time of a typical incongruent (IC) trial. The blue curve represents the timing signal (Eq. A5) which gates (multiplies) the δ unit activity (Eq. A4). The timing signal peaks halfway the most likely feedback interval, that is, where subjects expect feedback most likely to occur (cf. Appendix). IN trials typically lead to responses after the onset of the timing signal, evoking an anticipated δ activity (signal energy = size of gray area). The frequent activity of the δ unit reduces in the long run the reward expectations linked to IN cues; as a consequence, the subsequent reward to a correct IN trial leads to higher δ+ activations. The color intensity of yellow bars indicates the activation level (signal amplitude) after IC versus CO response. (B) In case of a smaller difference in RTs between CO and IN trials (like in Scheffers and Coles, 2000), the signal energy of anticipated δ responses for IN trials is also smaller (size of gray area). As a result, the δ unit has less opportunity to reduce reward expectation, and consequently also the δ+ response during the reward period is more similar for CO and IC trials (compare yellow bars after IC versus CO response). Second row Simulation 3, stimulus-locked activity of both the delta units (δ + δ+), for CO and IN correct trials. The process qualitatively illustrated in the first row is here shown corresponding to the Simulation 3 design specifications and results. The gray area shows the additional δ signal in IN versus CO trials; note that it is wider in (C) than in (D). Potentially, the δ activity could also account for the N2 wave (Yeung et al., 2004), if we include a mechanism for “partial error detection,” which has been proposed to be its origin (Burle et al., 2008). This remains to be developed, however. The dark yellow area is the additional δ+ signal during feedback for IN versus CO trials; note that it is bigger in (C) than in (D). Third row Stimulus-locked whole ACC activity (i.e., V + δ + δ+) in Simulation 3. As shown in the first row, due to the discounting effect of δ activity, IN trials evoked a lower reward expectation than CO trials, in both (E) [t(19) = 6.55, p < 0.0001] and (F) [t(19) = 7.54, p < 0.0001], while the pa ttern of activation reverses during the feedback period, showing a significant effect only in [(E) see also Figure 3 response-l ocked analysis in the main text]. Statistical analysis was conducted on the time bin 0–600 ms stimulus-locked, following the procedures described in the Section “Methods” of “Simulation 3.” Timescale in milliseconds.
Figure A2
Figure A2
Stimulus-locked activity of whole ACC module in correct trials of Simulation 4 (Error Likelihood). During the cue period (gray area) the ACC module of the RVPM codes for reward expectations. Hence, the system responds more strongly to Low Error-Likelihood trials (more rewarding) than to High Error-Likelihood trials [less rewarding; F(1,77) = 56.26, p < 0.0001]. For the same reasons described in Figure A1, the system showed also higher responses for Go trials (fast RTs) than to Change trials [slow RTs; F(1,77) = 14,17, p < 0.001]. In addition, the effect in the model was also partly due to differences in reward rates between Go and Change trials (consistent with the data of Brown and Braver, 2005). It must be noted that the fMRI data of Brown and Braver (2005) could reflect only the post-response epoch, because the cue period in the empirical paradigm was short and hence is not picked up by a slow hemodynamic measurement like fMRI. Statistical analysis was conducted on the time bin 0–600 ms stimulus-locked (gray area), following the procedures described in the Section “Methods” of “Simulation 4.” Timescale in milliseconds.
Figure A3
Figure A3
Time course of TSN signal during unrewarded trials in early, mid, and late stages of training (supplement to Figure 1C, right panel). The inhibition of dopaminergic activity increases as a function of trial number (compare dips in Early, Mid, Late curves). The vertical line indicates the expected time of reward release (missed, in this case). Timescale in milliseconds.

Similar articles

Cited by

References

    1. Amiez C., Joseph J. P., Procyk E. (2005). Anterior cingulate error-related activity is modulated by predicted reward. Eur. J. Neurosci. 21, 3447–345210.1111/j.1460-9568.2005.04170.x - DOI - PMC - PubMed
    1. Amiez C., Joseph J. P., Procyk E. (2006). Reward encoding in the monkey anterior cingulate cortex. Cereb. Cortex 16, 1040–105510.1093/cercor/bhj046 - DOI - PMC - PubMed
    1. Behrens T. E., Woolrich M. W., Walton M. E., Rushworth M. F. (2007). Learning the value of information in an uncertain world. Nat. Neurosci. 10, 1214–122110.1038/nn1954 - DOI - PubMed
    1. Botvinick M., Braver T. S., Barch D. M., Carter C. S., Cohen J. D. (2001). Conflict monitoring and cognitive control. Psychol. Rev. 108, 624–65210.1037/0033-295X.108.3.624 - DOI - PubMed
    1. Botvinick M., Nystrom L. E., Fissell K., Carter C. S., Cohen J. D. (1999). Conflict monitoring versus selection-for-action in anterior cingulate cortex. Nature 402, 179–18110.1038/46035 - DOI - PubMed

LinkOut - more resources