. 2011 Aug 11:2:43.
doi: 10.3389/fphys.2011.00043. eCollection 2011.

Cardiac electromechanical models: from cell to organ

Affiliations

Cardiac electromechanical models: from cell to organ

Natalia A Trayanova et al. Front Physiol. .

Abstract

The heart is a multiphysics and multiscale system that has driven the development of the most sophisticated mathematical models at the frontiers of computational physiology and medicine. This review focuses on electromechanical (EM) models of the heart from the molecular level of myofilaments to anatomical models of the organ. Because of the coupling in terms of function and emergent behaviors at each level of biological hierarchy, separation of behaviors at a given scale is difficult. Here, a separation is drawn at the cell level so that the first half addresses subcellular/single-cell models and the second half addresses organ models. At the subcellular level, myofilament models represent actin-myosin interaction and Ca-based activation. The discussion of specific models emphasizes the roles of cooperative mechanisms and sarcomere length dependence of contraction force, considered to be the cellular basis of the Frank-Starling law. A model of electrophysiology and Ca handling can be coupled to a myofilament model to produce an EM cell model, and representative examples are summarized to provide an overview of the progression of the field. The second half of the review covers organ-level models that require solution of the electrical component as a reaction-diffusion system and the mechanical component, in which active tension generated by the myocytes produces deformation of the organ as described by the equations of continuum mechanics. As outlined in the review, different organ-level models have chosen to use different ionic and myofilament models depending on the specific application; this choice has been largely dictated by compromises between model complexity and computational tractability. The review also addresses application areas of EM models such as cardiac resynchronization therapy and the role of mechano-electric coupling in arrhythmias and defibrillation.

Keywords: actin; activation; active tension; electromechanical model; heart; myofilament; myosin; stretch-induced arrhythmias.


Figures
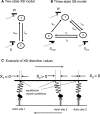
Figure 1
Figure 1
Models of crossbridge attachment and definition of distortion. (A) A two-state model of XB cycling in which the upper state is assumed to be either detached or weakly bound (state 1), while the lower state is attached or strongly bound (state 2). The schematic descriptions show a functional unit with troponin/tropomyosin, associated seven actin units, and one nearby XB (see text for details). (B) A three-state model of XB cycling in which state 1 corresponds to detached/weakly bound, state 2 represents strongly bound and pre-rotated, and state 3 represents strongly bound and post-rotated. The transition rates between states are bidirectional, except for the transition rate gXB between state 3 and 1 that correspond to the release of ADP and the binding of ATP, so that reverse rate is essentially zero. (C) Schematic diagram shows examples of crossbridge distortion values. The myosin heads are assumed to bind to actin sites and generate force that is directly proportional to the distortion defined as the distance from the equilibrium position to the actin site in the direction parallel to the filaments (the example shows X2 > X3 > X1). Muscle shortening causes motions of the thick and thin filaments that are shown by the gray arrows, such that distortion values decrease with time (i.e., dXn/dt < 0 for n = 1, 2, 3, etc.).
Figure 2
Figure 2
Proteins in Ca-based activation and cooperative mechanism. (A) The illustration shows the key proteins in muscle contraction in the rest (above) and the activated (below) positions. A myosin head (S1, blue) with light chain 1 (LC1, red) and light chain 2 (LC2) is shown in two positions, detached (above) and bound (below). Actin (black) forms a two-stranded helix that is the backbone of the thin filament. A tropomyosin unit (gray) is a two-stranded helix that spans seven actin units and connects in an end-to-end fashion with its two neighbors. Troponin is a complex of three proteins: TnC, TnI, and TnT. As shown in the lower panel below, with binding of Ca to the regulatory site on TnC, TnI rotates to change TnT and troponin to a permissive position that allows myosin to bind. (Figure modified from illustration provided by J. Solaro in Bers, , with permission.) (B) The figure schematically illustrates three putative cooperative mechanisms: XB–RU shows that the binding of an XB increases the affinity of the associated RU; RU–RU shows that RU units are connected (red link) that promotes similarity with the two neighbors; and XB–XB shows that a bound XB increases the binding rate of a neighboring XB. (C) Figure shows the SL dependence of isometric responses. Left panel: average force–Ca2+ relationships (pooled data, skinned rat cardiac trabeculae, n = 10) at five SLs; data are fitted to a Hill relationship. The level of cooperativity, assessed by the Hill coefficient, is essentially not affected by SL (from Dobesh et al., , with permission). Right panel: effect of SL on force during twitches. Different traces show normalized different SLs (in micrometers) as indicated in key. Force is normalized so that maximal force corresponds to a value of 1.0. As SL increases, the peak force increases, while the time to peak is mostly constant. In additions, the relaxation phase is slowed so that the total twitch duration is an increasing function of SL. (from Janssen and Hunter, , with permission).
Figure 3
Figure 3
Whole-heart modeling. (A) Schematic of the general approach to modeling cardiac EM function. (B) Geometrical models of the heart. (C) Computational meshes of the canine heart for the electrical and mechanical problems. (D) Fiber and sheet orientations obtained from DTMR imaging of the canine heart. Modified with permission from Trayanova (2011).
Figure 4
Figure 4
Mechanisms underlying the EM delay (EMD) in the rabbit heart for sinus rhythm and epicardial pacing. (A) Transmural maps of strain in the fiber direction during systole. Arrows indicate early shortening and prestretching during the isovolumic phase. (B) Epicardial fiber strain at four epicardial locations. IVC: isovolumic contraction; EJ: ejection. Modified with permission from Gurev et al. (2010).
Figure 5
Figure 5
Defibrillation of the normal and dilated heart. (A) Short axis view of ventricular geometry and fiber helix angle. (B) The ventricles with ICD-like electrode configuration in anterior (left) and basal (right) views. RV catheter (red) is in the RV cavity and the active can (blue) is in the bath near the posterior LV wall. (C) Distribution of electrical field magnitude in the normal and dilated ventricles.
Figure 6
Figure 6
Active tension, rate of tension development, and regional stretch in the presence of baseline, amplified, and attenuated length-dependent tension regulation for the three regions shown in (A), (1) septum (red), (2) posterior lateral wall (yellow), and (3) anterior lateral wall (blue). Line colors correspond to these regions. Dashed and solid lines correspond to paced and sinus rhythm activations. (B–D): active tension; (E–G): rate of change of active tension; (I–K): fiber stretch. (H) Percentage change in dP/dtmax between sinus rhythm and LV pacing for the cases of −50, 100, and +50% length-dependent tension regulation. Reprinted with permission from Niederer et al. (2011).

Similar articles

Cited by

References

    1. Abraham W. T., Fisher W. G., Smith A. L., Delurgio D. B., Leon A. R., Loh E., Kocovic D. Z., Packer M., Clavell A. L., Hayes D. L., Ellestad M., Trupp R. J., Underwood J., Pickering F., Truex C., Mcatee P., Messenger J. (2002). Cardiac resynchronization in chronic heart failure. N. Engl. J. Med. 346, 1845–185310.1056/NEJMoa013168 - DOI - PubMed
    1. Adler D., Wong A. Y., Mahler Y. (1985). Model of mechanical alternans in the mammalian myocardium. J. Theor. Biol. 117, 563–57710.1016/S0022-5193(85)80238-1 - DOI - PubMed
    1. Akella A. B., Su H., Sonnenblick E. H., Rao V. G., Gulati J. (1997). The cardiac troponin C isoform and the length dependence of Ca2+ sensitivity of tension in myocardium. J. Mol. Cell. Cardiol. 29, 381–38910.1016/S0735-1097(97)87248-8 - DOI - PubMed
    1. Arts T., Reneman R. S., Veenstra P. C. (1979). A model of the mechanics of the left ventricle. Ann. Biomed. Eng. 7, 299–31810.1007/BF02364118 - DOI - PubMed
    1. Ashikaga H., Coppola B., Hopenfeld B., Leifer E., Mcveigh E., Omens J. (2007). Transmural dispersion of myofiber mechanics: implications for electrical heterogeneity in vivo. J. Am. Coll. Cardiol. 49, 909–91610.1016/j.jacc.2006.07.074 - DOI - PMC - PubMed