

Influenza and pneumonia mortality in 66 large cities in the United States in years surrounding the 1918 pandemic
- PMID: 21886792
- PMCID: PMC3158768
- DOI: 10.1371/journal.pone.0023467
Influenza and pneumonia mortality in 66 large cities in the United States in years surrounding the 1918 pandemic
Abstract
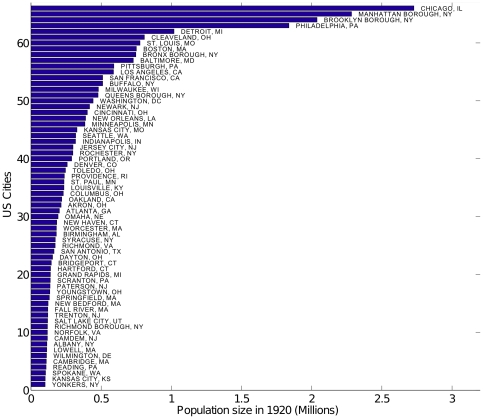
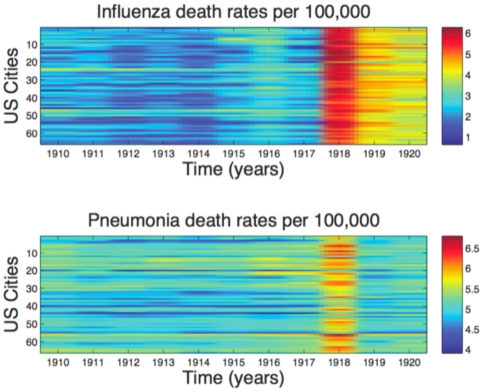
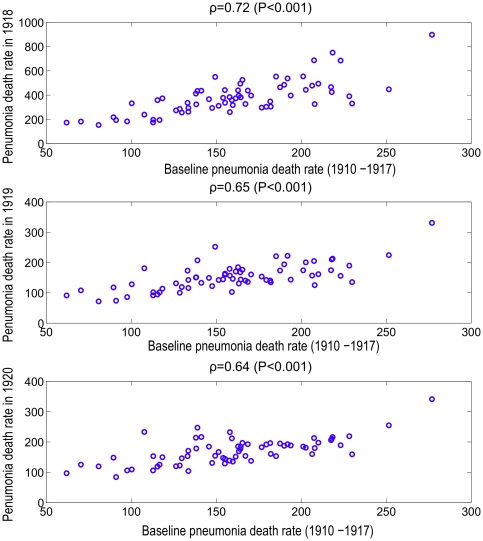
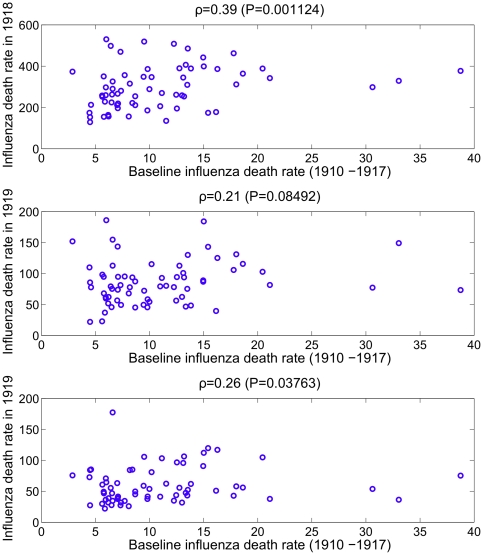
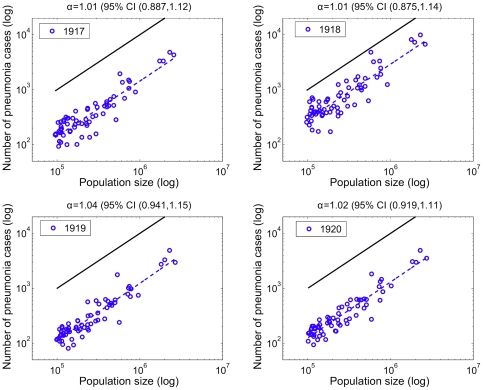
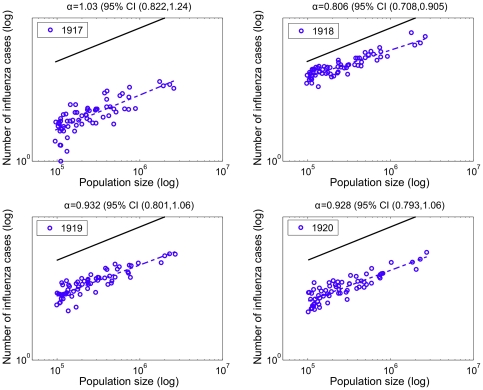
The 1918 influenza pandemic was a major epidemiological event of the twentieth century resulting in at least twenty million deaths worldwide; however, despite its historical, epidemiological, and biological relevance, it remains poorly understood. Here we examine the relationship between annual pneumonia and influenza death rates in the pre-pandemic (1910-17) and pandemic (1918-20) periods and the scaling of mortality with latitude, longitude and population size, using data from 66 large cities of the United States. The mean pre-pandemic pneumonia death rates were highly associated with pneumonia death rates during the pandemic period (Spearman ρ = 0.64-0.72; P<0.001). By contrast, there was a weak correlation between pre-pandemic and pandemic influenza mortality rates. Pneumonia mortality rates partially explained influenza mortality rates in 1918 (ρ = 0.34, P = 0.005) but not during any other year. Pneumonia death counts followed a linear relationship with population size in all study years, suggesting that pneumonia death rates were homogeneous across the range of population sizes studied. By contrast, influenza death counts followed a power law relationship with a scaling exponent of ∼0.81 (95%CI: 0.71, 0.91) in 1918, suggesting that smaller cities experienced worst outcomes during the pandemic. A linear relationship was observed for all other years. Our study suggests that mortality associated with the 1918-20 influenza pandemic was in part predetermined by pre-pandemic pneumonia death rates in 66 large US cities, perhaps through the impact of the physical and social structure of each city. Smaller cities suffered a disproportionately high per capita influenza mortality burden than larger ones in 1918, while city size did not affect pneumonia mortality rates in the pre-pandemic and pandemic periods.
Conflict of interest statement
Figures
References
-
- Johnson NP, Mueller J. Updating the accounts: global mortality of the 1918–1920 “Spanish” influenza pandemic. Bull Hist Med. 2002;76:105–115. - PubMed
-
- Murray CJ, Lopez AD, Chin B, Feehan D, Hill KH. Estimation of potential global pandemic influenza mortality on the basis of vital registry data from the 1918–20 pandemic: a quantitative analysis. Lancet. 2006;368:2211–2218. - PubMed
-
- Patterson KD, Pyle GF. The geography and mortality of the 1918 influenza pandemic. Bull Hist Med. 1991;65:4–21. - PubMed
Publication types
MeSH terms
LinkOut - more resources
Full Text Sources
Medical
