

Assessing Google flu trends performance in the United States during the 2009 influenza virus A (H1N1) pandemic
- PMID: 21886802
- PMCID: PMC3158788
- DOI: 10.1371/journal.pone.0023610
Assessing Google flu trends performance in the United States during the 2009 influenza virus A (H1N1) pandemic
Abstract
Background: Google Flu Trends (GFT) uses anonymized, aggregated internet search activity to provide near-real time estimates of influenza activity. GFT estimates have shown a strong correlation with official influenza surveillance data. The 2009 influenza virus A (H1N1) pandemic [pH1N1] provided the first opportunity to evaluate GFT during a non-seasonal influenza outbreak. In September 2009, an updated United States GFT model was developed using data from the beginning of pH1N1.
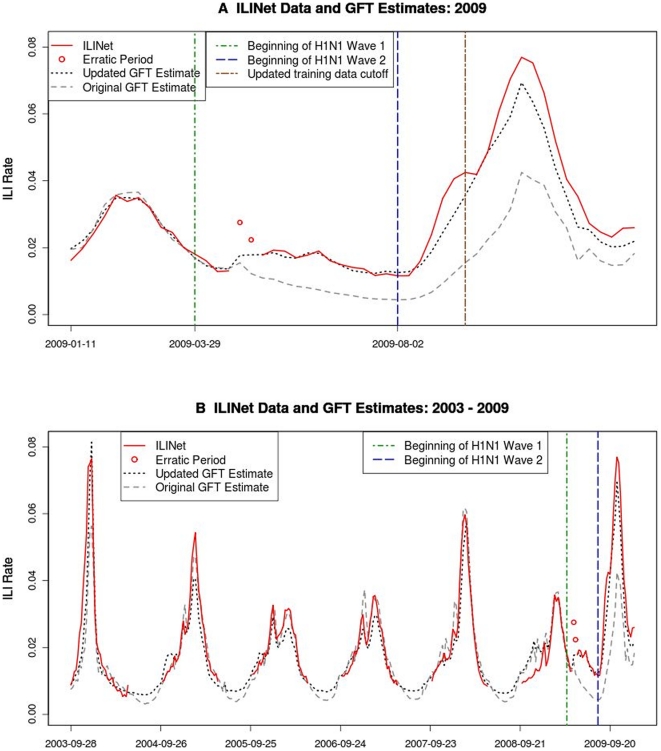
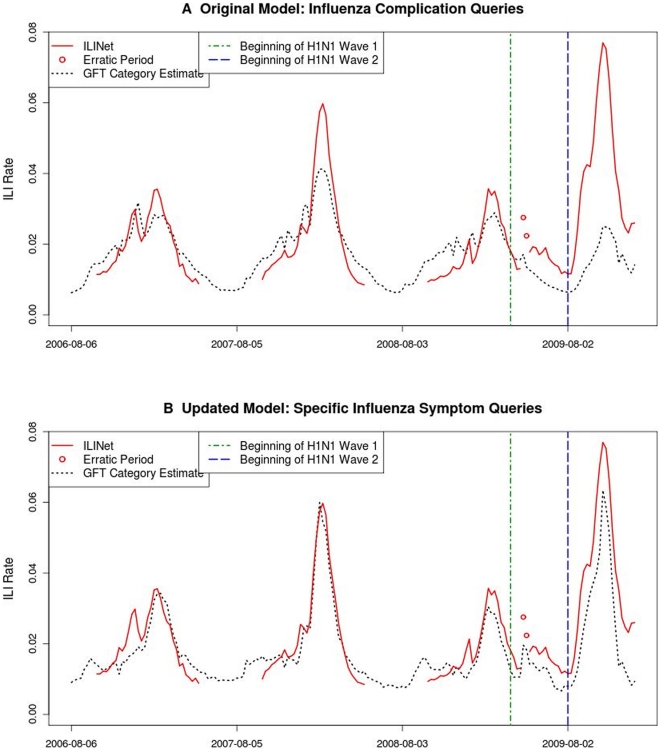
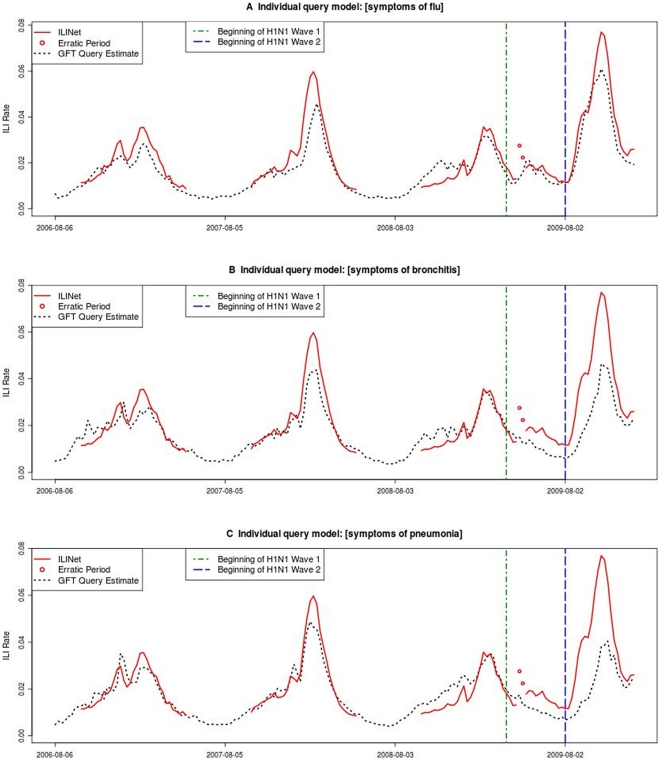
Methodology/principal findings: We evaluated the accuracy of each U.S. GFT model by comparing weekly estimates of ILI (influenza-like illness) activity with the U.S. Outpatient Influenza-like Illness Surveillance Network (ILINet). For each GFT model we calculated the correlation and RMSE (root mean square error) between model estimates and ILINet for four time periods: pre-H1N1, Summer H1N1, Winter H1N1, and H1N1 overall (Mar 2009-Dec 2009). We also compared the number of queries, query volume, and types of queries (e.g., influenza symptoms, influenza complications) in each model. Both models' estimates were highly correlated with ILINet pre-H1N1 and over the entire surveillance period, although the original model underestimated the magnitude of ILI activity during pH1N1. The updated model was more correlated with ILINet than the original model during Summer H1N1 (r = 0.95 and 0.29, respectively). The updated model included more search query terms than the original model, with more queries directly related to influenza infection, whereas the original model contained more queries related to influenza complications.
Conclusions: Internet search behavior changed during pH1N1, particularly in the categories "influenza complications" and "term for influenza." The complications associated with pH1N1, the fact that pH1N1 began in the summer rather than winter, and changes in health-seeking behavior each may have played a part. Both GFT models performed well prior to and during pH1N1, although the updated model performed better during pH1N1, especially during the summer months.
Conflict of interest statement
Figures
References
-
- http://www.google.org/flutrends. Google Flu Trends. 2009. Google.org. Available: www.google.org/flutrends. Accessed 2011 July 28.
-
- CDC - Seasonal Influenza (Flu) - Flu Activity & Surveillance. Available: http://www.cdc.gov/flu/weekly/fluactivitysurv.htm. Accessed 2011 July 28.
-
- Ginsberg J, Mohebbi MH, Patel RS, Brammer L, Smolinski MS, et al. Detecting influenza epidemics using search engine query data. Nature. 2008;457:1012–10155. DOI: http://www.nature.com/nature/journal/v457/n7232/full/nature07634.html. Accessed 2011 July 28. - PubMed
-
- Kelly H, Grant K. Interim analysis of pandemic influenza (H1N1) 2009 in Australia: surveillance trends, age of infection and effectiveness of seasonal vaccination. Euro Surveill. 2009;14(31):pii = 19288. Available: http://www.eurosurveillance.org/ViewArticle.aspx?ArticleId=19288. Accessed 2011 July 28. - PubMed
-
- Wilson N, Mason K, Tobias M, Peacey M, Huang QS, et al. Interpreting “GFT” Data for Pandemic H1N1: The New Zealand Experience. EuroSurveill. 2009;14(44):pii = 19386. Available: http://www.eurosurveillance.org/ViewArticle.aspx?ArticleId=19386. Accessed 2011 July 28. - PubMed
Publication types
MeSH terms
LinkOut - more resources
Full Text Sources
Medical
Research Materials
