An Automated Measurement of Ciliary Beating Frequency using a Combined Optical Flow and Peak Detection
- PMID: 21886872
- PMCID: PMC3155168
- DOI: 10.4258/hir.2011.17.2.111
An Automated Measurement of Ciliary Beating Frequency using a Combined Optical Flow and Peak Detection
Abstract
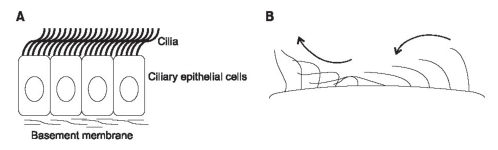
Objectives: The mucociliary transport system is a major defense mechanism of the respiratory tract. The performance of mucous transportation in the nasal cavity can be represented by a ciliary beating frequency (CBF). This study proposes a novel method to measure CBF by using optical flow.
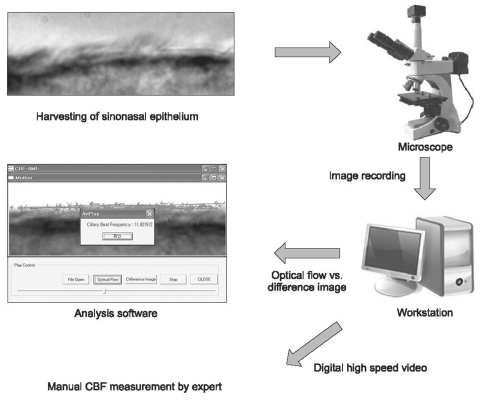
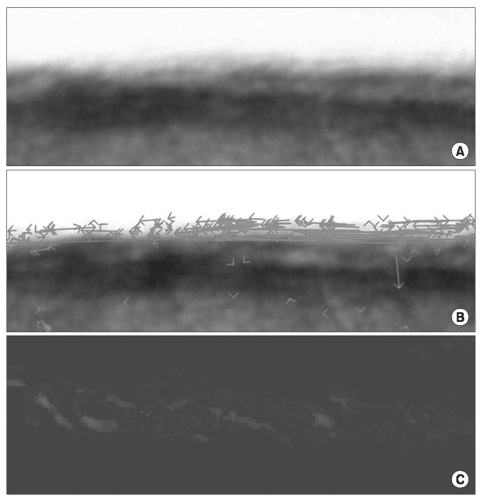
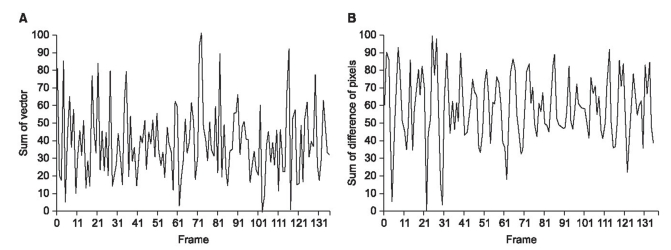
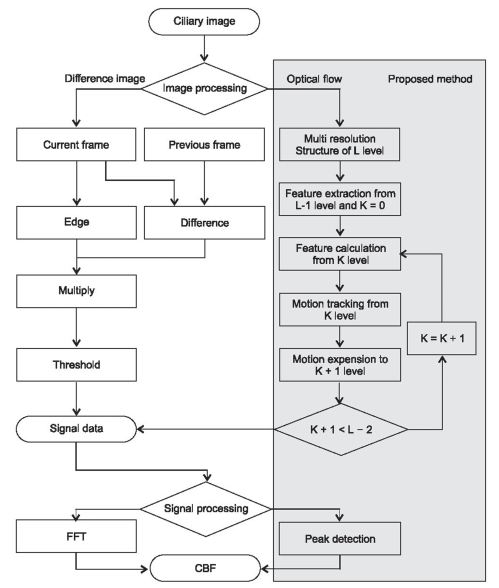
Methods: To obtain objective estimates of CBF from video images, an automated computer-based image processing technique is developed. This study proposes a new method based on optical flow for image processing and peak detection for signal processing. We compare the measuring accuracy of the method in various combinations of image processing (optical flow versus difference image) and signal processing (fast Fourier transform [FFT] vs. peak detection [PD]). The digital high-speed video method with a manual count of CBF in slow motion video play, is the gold-standard in CBF measurement. We obtained a total of fifty recorded ciliated sinonasal epithelium images to measure CBF from the Department of Otolaryngology. The ciliated sinonasal epithelium images were recorded at 50-100 frames per second using a charge coupled device camera with an inverted microscope at a magnification of ×1,000.
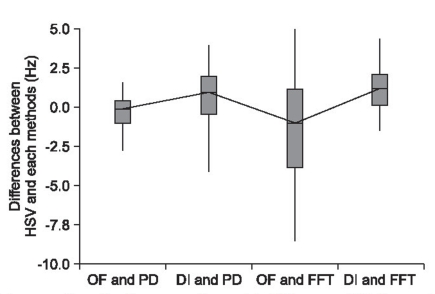
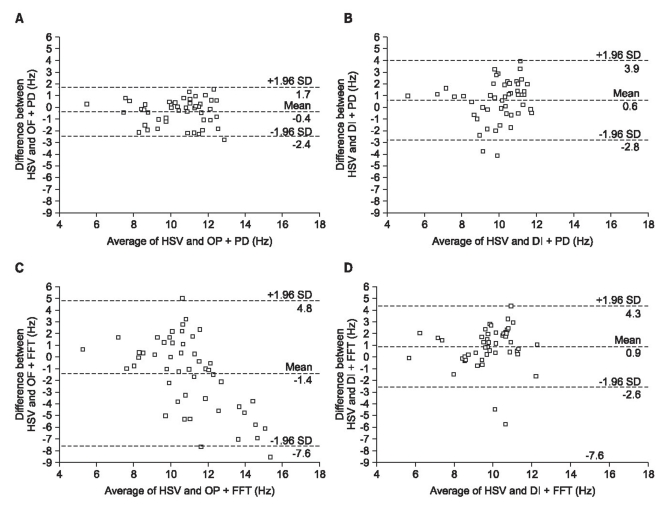
Results: The mean square errors and variance for each method were 1.24, 0.84 Hz; 11.8, 2.63 Hz; 3.22, 1.46 Hz; and 3.82, 1.53 Hz for optical flow (OF) + PD, OF + FFT, difference image [DI] + PD, and DI + FFT, respectively. Of the four methods, PD using optical flow showed the best performance for measuring the CBF of nasal mucosa.
Conclusions: The proposed method was able to measure CBF more objectively and efficiently than what is currently possible.
Keywords: Cilia; Computer-Assisted Image Processing; Computer-Assisted Signal Processing; Mucociliary Clearance.
Conflict of interest statement
No potential conflict of interest relevant to this article was reported.
Figures
References
-
- Wanner A, Salathe M, O'Riordan TG. Mucociliary clearance in the airways. Am J Respir Crit Care Med. 1996;154(6 Pt 1):1868–1902. - PubMed
-
- Rayner CF, Rutman A, Dewar A, Cole PJ, Wilson R. Ciliary disorientation in patients with chronic upper respiratory tract inflammation. Am J Respir Crit Care Med. 1995;151(3 Pt 1):800–804. - PubMed
-
- Satir P, Sleigh MA. The physiology of cilia and mucociliary interactions. Annu Rev Physiol. 1990;52:137–155. - PubMed
-
- Dalhamn T. Ciliary motility studies. Arch Intern Med. 1970;126:424–427. - PubMed
LinkOut - more resources
Full Text Sources
Research Materials