. 2011 Aug 17:5:50.
doi: 10.3389/fnbeh.2011.00050. eCollection 2011.

Relaxin-3-deficient mice showed slight alteration in anxiety-related behavior

Affiliations

Relaxin-3-deficient mice showed slight alteration in anxiety-related behavior

Yoshihisa Watanabe et al. Front Behav Neurosci. .

Abstract

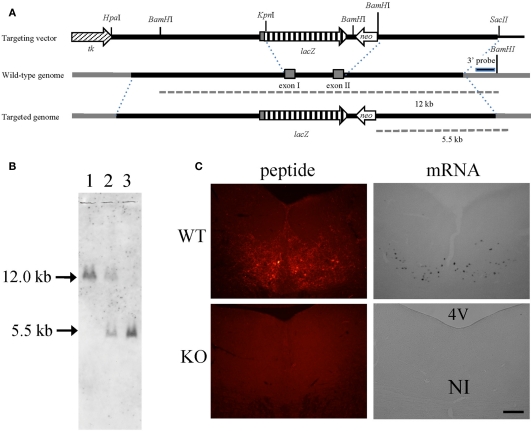
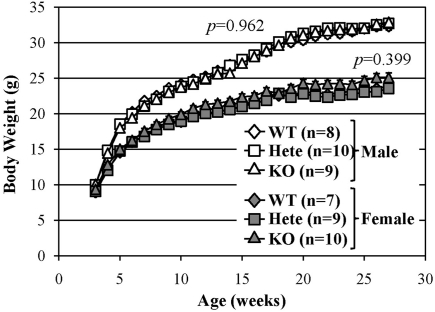
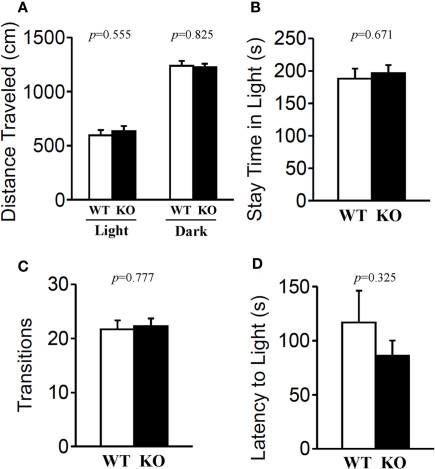
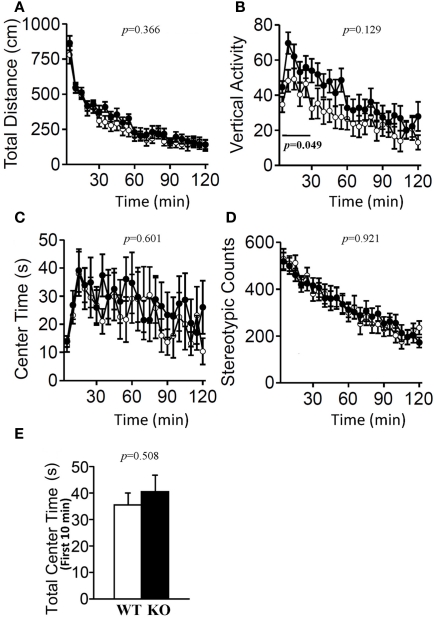
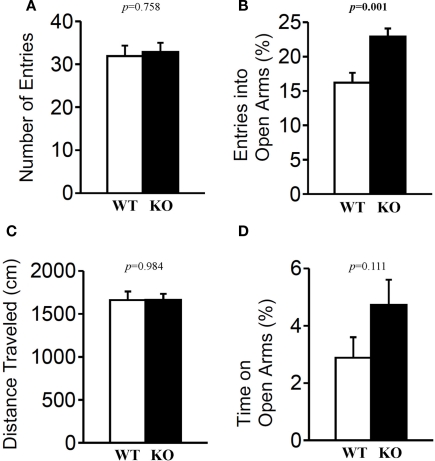
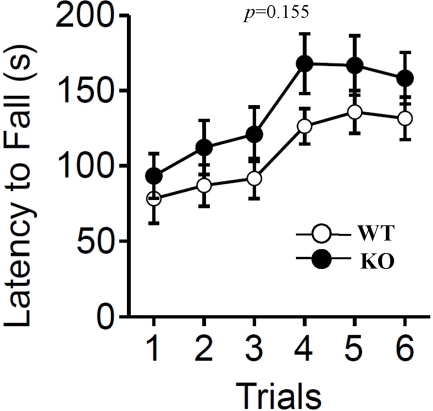
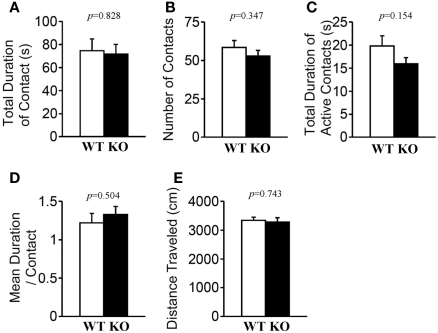
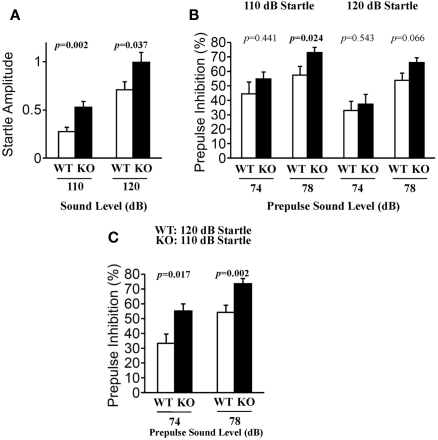
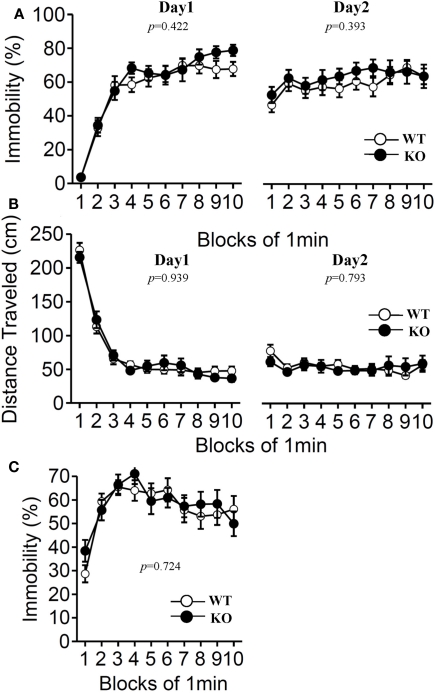
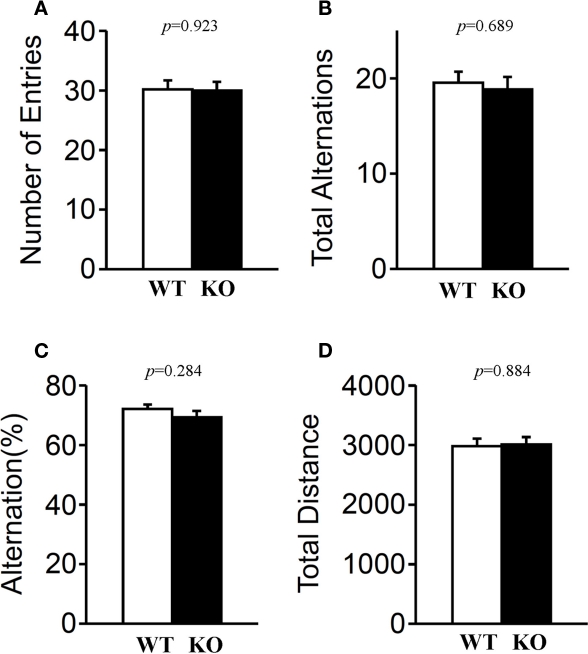
Relaxin-3 is a neuropeptide belonging to the relaxin/insulin superfamily. Studies using rodents have revealed that relaxin-3 is predominantly expressed in neurons in the nucleus incertus (NI) of the pons, the axons of which project to forebrain regions including the hypothalamus. There is evidence that relaxin-3 is involved in several functions, including food intake and stress responses. In the present study, we generated relaxin-3 gene knockout (KO) mice and examined them using a range of behavioral tests of sensory/motor functions and emotion-related behaviors. The results revealed that relaxin-3 KO mice exhibited normal growth and appearance, and were generally indistinguishable from wild genotype littermates. There was no difference in bodyweight among genotypes until at least 28 weeks after birth. In addition, there were no significant differences between wild-type and KO mice in locomotor activity, social interaction, hot plate test performance, fear conditioning, depression-like behavior, and Y-maze test performance. However, in the elevated plus maze test, KO mice exhibited a robust increase in the tendency to enter open arms, although they exhibited normal performance in a light/dark transition test and showed no difference from wild-type mice in the time spent in central area in the open field test. On the other hand, a significant increase in the acoustic startle response was observed in KO mice. These results indicate that relaxin-3 is slightly involved in the anxiety-related behavior.

Keywords: anxiety; elevated plus maze; gene knockout; mouse; relaxin-3.


Figures

Figure 1
Figure 1
Relaxin-3 KO mice. (A) Construction of the targeting vector for producing relaxin-3 KO mice. The genomic region between exon I and exon II of relaxin-3 gene was disrupted by PGK-neomycin resistance cassette. (B) Southern blot of BamHI-digested genomic DNA using a 3′ external probe. The DNA bands indicated by arrows (12 kb and 5.5 kb) correspond to the BamHI-fragments shown in (A). Lanes 1, 2, and 3 are WT (relaxin-3+/+), heterozygote (relaxin-3+/−), and KO (relaxin-3−/−), respectively. Note that the DNA band in lane 2 is half as intense as that in lane 1 and 3. (C) The expression of relaxin-3 was confirmed by immunohistochemistry (left) and in situ hybridization (right) of brain sections from wild-type (upper) and relaxin-3 KO (lower) mice. Neither relaxin-3 nor mRNA peptide was detected in the nucleus incertus (NI) of KO mice.
Figure 2
Figure 2
Normal growth of relaxin-3 KO mice. The body weight in the wild-type (WT), heterozygote (Hete), or KO male and female mice was measured during postnatal development. Body weight is presented as mean ± SEM. Data were analyzed with repeated measures ANOVA. p-Values indicate significance of genotype effect.
Figure 3
Figure 3
Light/dark transition test. Wild-type (n = 19) and relaxin-3 KO (n = 20) mice were placed individually in the dark compartment at the start of the test. Distance traveled in the light/dark compartments (A), time spent in light compartment (B), number of light/dark transitions (C), and latency to enter the light compartment (D) were recorded. Data are presented as mean ± SEM. p-Values were calculated by Student's t-test or Mann–Whitney's U-test.
Figure 4
Figure 4
Open field test. Total locomotion distance traveled (A), vertical activity (B), time spent in the center of the compartment (C), and stereotypic behavior (D) were recorded. Data are presented as mean ± SEM (n = 20 each). p-Values indicate significance of genotype effect in two-way repeated measures ANOVA. The vertical activity during the first 30 min (bar) was statistically significant (p = 0.049). (E) Data of the time spent in the central area during the first 10 min were also statistically analyzed using Student's t-test.
Figure 5
Figure 5
Elevated plus maze test. Mice (n = 20 each) completed the elevated plus maze test. The number of arm entries (A), percentage of entry into open arms (B), distance traveled (C), and time spent in open arms (D) were recorded. Data are presented as mean ± SEM. p-Values were calculated by Student's t-test.
Figure 6
Figure 6
Rotarod test. The rotarod test was performed to measure motor function of wild-type (WT) and relaxin-3 KO (KO) mice. The latency to fall from an accelerating rotarod was measured in three trials per day. Data are presented as mean ± SEM (n = 20 each). p-Values indicate significance of genotype effect in two-way repeated measures ANOVA.
Figure 7
Figure 7
Social interaction in a novel environment. Total duration of contacts (A), number of contacts (B), total duration of active contacts (C), mean duration of each contact (D), and total distance traveled (E) were recorded. p-Values were calculated by Student's t-test.
Figure 8
Figure 8
Prepulse inhibition test. Prepulse inhibition was measured by a combination of startle (110 or 120 dB) and two prepulse levels (74 and 78 dB) in wild-type (n = 20) and relaxin-3 KO (n = 20) mice. Startle responses without prepulses (A) and prepulse inhibition of the startle reflex (B,C) were recorded. Startle response amplitude and prepulse inhibition are presented as mean ± SEM and as the mean percent reduction ± SEM, respectively. p-Values were calculated by Student's t-test or Mann–Whitney's U-test.
Figure 9
Figure 9
Porsolt forced swim test and tail suspension test. The Porsolt forced swim test (A,B). Immobility time (A) and total distance traveled (B) were recorded in each block for days 1 and 2 (n = 20 each). Tail suspension test (C). Data are presented as mean ± SEM. p-Values indicate significance of genotype effect in two-way repeated measures ANOVA.
Figure 10
Figure 10
Contextual and cued fear conditioning and hot plate test. Memory consolidation was assessed with contextual and cued fear conditioning tests. Wild-type (n = 20) or relaxin-3 KO (n = 20) mice were placed in a novel environment chamber for 8 min, where they received three electrical foot shocks. Freezing time (A) and distance traveled (F) were recorded. A tone was presented for 30 s (bars) followed by a 2-s foot shock (arrowheads). Twenty-four hours later, mice were placed in the same [context; (B,D)] or modified [cue; (C,E)] chamber, and freezing time was measured as an indicator of memory consolidation. Data are presented as mean ± SEM. p-Values indicate significance of genotype effect in two-way repeated measures ANOVA. Pain sensitivity was confirmed by the hot plate test (G). Data are presented as mean ± SEM. p-Values were calculated by Student's t-test.
Figure 11
Figure 11
Y-maze test. Mice (n = 20 each) were individually placed into a symmetrical Y-maze. Total number of arm entries (A), number (B) and percentage (C) of alternation between Y-maze arms, and total distance (D) were recorded. Data presented as mean ± SEM. p-Values were calculated by Student's t-test.

References

    1. Anseloni V. Z., Brandao M. L. (1997). Ethopharmacological analysis of behaviour of rats using variations of the elevated plus-maze. Behav. Pharmacol. 8, 533–54010.1097/00008877-199711000-00011 - DOI - PubMed
    1. Anseloni V. Z., Motta V., Lima G., Brandao M. L. (1995). Behavioral and pharmacological validation of the elevated plus maze constructed with transparent walls. Braz. J. Med. Biol. Res. 28, 597–601 - PubMed
    1. Bathgate R. A., Samuel C. S., Burazin T. C., Layfield S., Claasz A. A., Reytomas I. G., Dawson N. F., Zhao C., Bond C., Summers R. J., Parry L. J., Wade J. D., Tregear G. W. (2002). Human relaxin gene 3 (H3) and the equivalent mouse relaxin (M3) gene. Novel members of the relaxin peptide family. J. Biol. Chem. 277, 1148–115710.1074/jbc.M107882200 - DOI - PubMed
    1. Boels K., Schaller H. C. (2003). Identification and characterisation of GPR100 as a novel human G-protein-coupled bradykinin receptor. Br. J. Pharmacol. 140, 932–93810.1038/sj.bjp.0705521 - DOI - PMC - PubMed
    1. Bullesbach E. E., Yang S., Schwabe C. (1992). The receptor-binding site of human relaxin II. A dual prong-binding mechanism. J. Biol. Chem. 267, 22957–22960 - PubMed