

Systematic clustering of transcription start site landscapes
- PMID: 21887249
- PMCID: PMC3160847
- DOI: 10.1371/journal.pone.0023409
Systematic clustering of transcription start site landscapes
Abstract
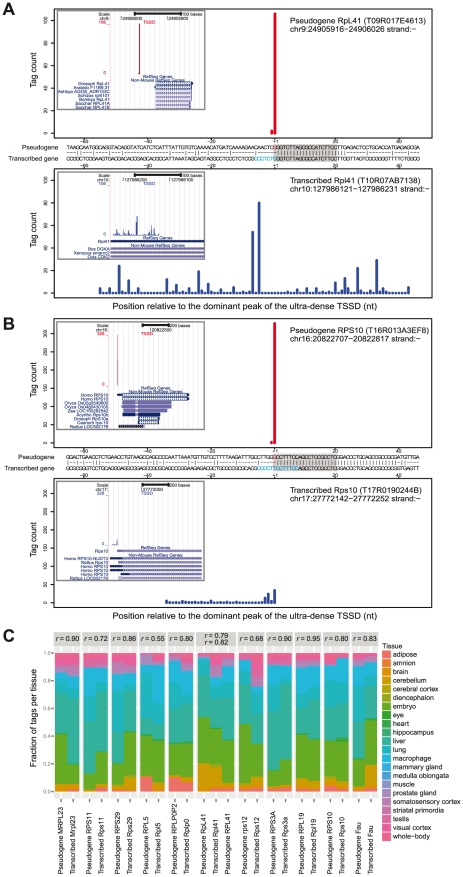
Genome-wide, high-throughput methods for transcription start site (TSS) detection have shown that most promoters have an array of neighboring TSSs where some are used more than others, forming a distribution of initiation propensities. TSS distributions (TSSDs) vary widely between promoters and earlier studies have shown that the TSSDs have biological implications in both regulation and function. However, no systematic study has been made to explore how many types of TSSDs and by extension core promoters exist and to understand which biological features distinguish them. In this study, we developed a new non-parametric dissimilarity measure and clustering approach to explore the similarities and stabilities of clusters of TSSDs. Previous studies have used arbitrary thresholds to arrive at two general classes: broad and sharp. We demonstrated that in addition to the previous broad/sharp dichotomy an additional category of promoters exists. Unlike typical TATA-driven sharp TSSDs where the TSS position can vary a few nucleotides, in this category virtually all TSSs originate from the same genomic position. These promoters lack epigenetic signatures of typical mRNA promoters and a substantial subset of them are mapping upstream of ribosomal protein pseudogenes. We present evidence that these are likely mapping errors, which have confounded earlier analyses, due to the high similarity of ribosomal gene promoters in combination with known G addition bias in the CAGE libraries. Thus, previous two-class separations of promoter based on TSS distributions are motivated, but the ultra-sharp TSS distributions will confound downstream analyses if not removed.
Conflict of interest statement
Figures
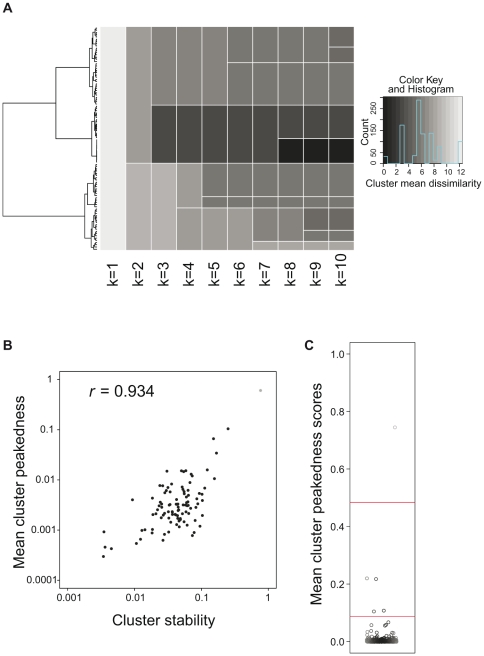
 ), the next the three cluster partition (
 ), etc. The color intensity indicates the mean dissimilarity between all the TSSDs within one cluster (darker means higher homogeneity). Note that most clusters are inhomogeneous when k is low: clusters with high homogeneity only emerge when moving the cutline closer to the leaves. (B) Correlation between the mean cluster peakedness and the cluster stability. The scatter plot compares the cluster stability scores resulting from the bootstrap resampling to the intra-cluster peakedness scores. R denotes the Pearson's correlation coefficient of the scores (
 ). (C) Distribution of intra-cluster peakedness scores of 500 TSSD clusters generated by hierarchical clustering. The Y-axis shows the intra-cluster peakedness scores. The red lines indicate offsets for defining three larger clusters using k-means. Each box represents one TSSD cluster.

References
-
- Smale ST, Kadonaga JT. The RNA polymerase II core promoter. Annu Rev Biochem. 2003;72:449–479. - PubMed
-
- Carninci P, Kasukawa T, Katayama S, Gough J, Frith MC, et al. The transcriptional landscape of the mammalian genome. Science. 2005;309:1559–1563. - PubMed
-
- Maruyama K, Sugano S. Oligo-capping: a simple method to replace the cap structure of eukaryotic mRNAs with oligoribonucleotides. Gene. 1994;138:171–174. - PubMed
Publication types
MeSH terms
Substances
LinkOut - more resources
Full Text Sources
Other Literature Sources
Molecular Biology Databases
