. 2011;6(8):e23495.
doi: 10.1371/journal.pone.0023495. Epub 2011 Aug 22.

Comprehensive study in the inhibitory effect of berberine on gene transcription, including TATA box

Affiliations

Comprehensive study in the inhibitory effect of berberine on gene transcription, including TATA box

Yugang Wang et al. PLoS One. 2011.

Abstract

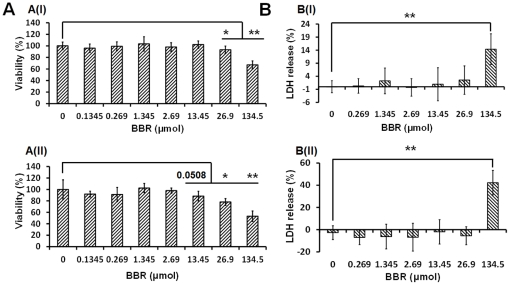
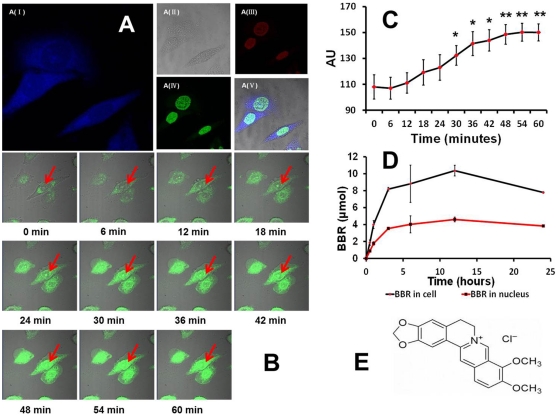
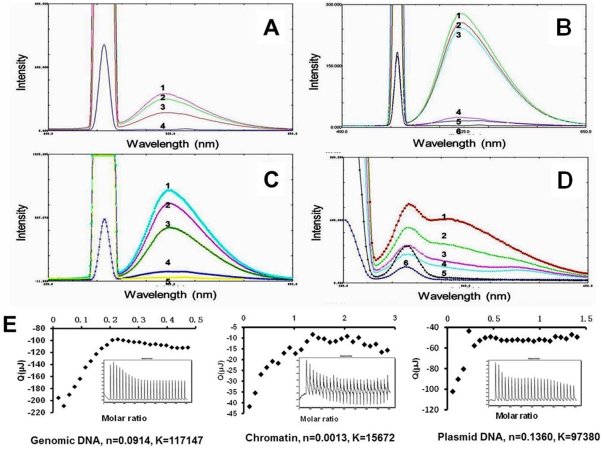
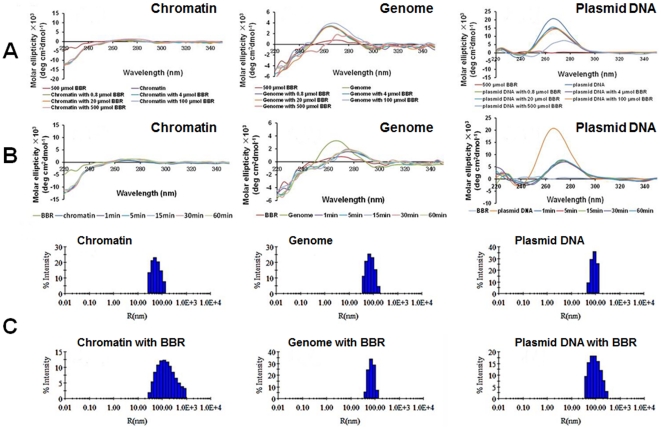
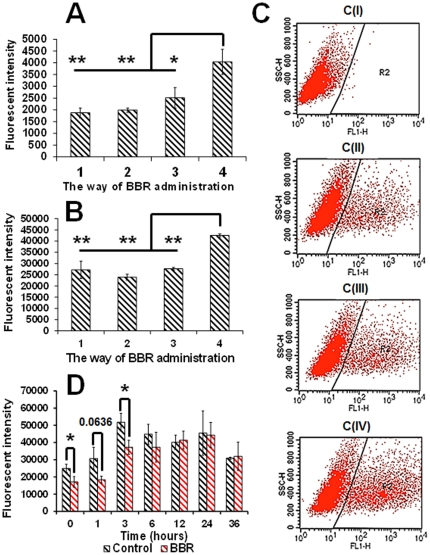
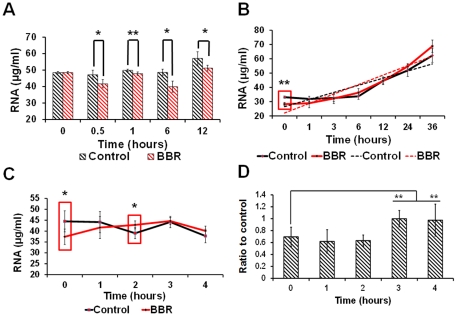
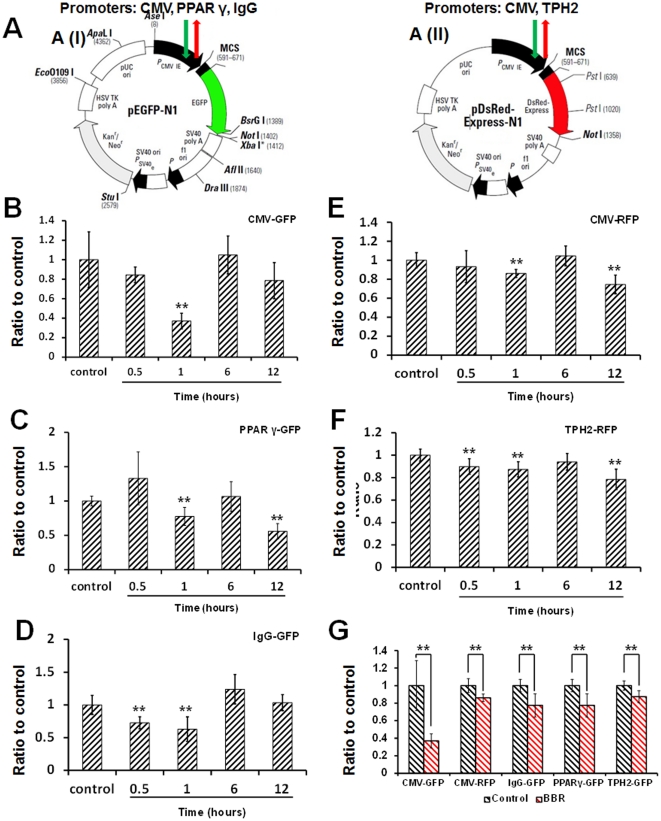
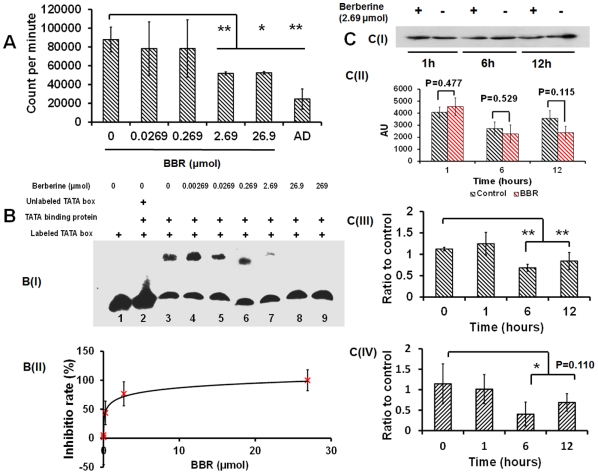
Berberine (BBR) is an established natural DNA intercalator with numerous pharmacological functions. However, currently there are neither detailed reports concerning the distribution of this alkaloid in living cells nor reports concerning the relationship between BBR's association with DNA and the function of DNA. Here we report that the distribution of BBR within the nucleus can be observed 30 minutes after drug administration, and that the content of berberine in the nucleus peaks at around 4 µmol, which is twelve hours after drug administration. The spatial conformation of DNA and chromatin was altered immediately after their association with BBR. Moreover, this association can effectively suppress the transcription of DNA in living cell systems and cell-free systems. Electrophoretic mobility shift assays (EMSA) demonstrated further that BBR can inhibit the association between the TATA binding protein (TBP) and the TATA box in the promoter, and this finding was also attained in living cells by chromatin immunoprecipitation (ChIP). Based on results from this study, we hypothesize that berberine can suppress the transcription of DNA in living cell systems, especially suppressing the association between TBP and the TATA box by binding with DNA and, thus, inhibiting TATA box-dependent gene expression in a non-specific way. This novel study has significantly expanded the sphere of knowledge concerning berberine's pharmacological effects, beginning at its paramount initial interaction with the TATA box.


Conflict of interest statement

Competing Interests: The authors have declared that no competing interests exist.

Figures

Figure 1
Figure 1. Cytotoxicity assay of berberine.
(A) represents the cytotoxicity of BBR from the MTT assay: A(I) and A(II) represent the cytotoxicity of BBR to PC12 cells 12 hours and 24 hours after drug administration, respectively; (B) represents the LDH release of PC12 cells after BBR addition: B(I) and B(II) represent the amount of LDH released from PC12 cells 12 hours and 24 hours since BBR incubation. In the MTT assay, the group with 0 µmol of BBR was considered the control group; in LDH release assay, the spontaneous release of LDH from the BBR-free group (0 µmol) was considered the control group. The percentage of LDH release was calculated by the equation: LDH release (%) = (Experimental LDH release-Spontaneous LDH release)/Maximum LDH release. * p<0.05, ** p<0.01 vs control. Data were presented as mean ± S.D. from twelve independent experiments. (n = 12).
Figure 2
Figure 2. Distribution of berberine in a living cell.
(A) (from I to V) depicts images of the subcellular location of BBR in PC12 cells one hour after BBR administration. The fluorescence of BBR is shown in blue in A (I); A (II) represents PC12 cells in visible light; A (III) and A (IV) represents the nucleus stained by PI and AO, respectively; figure A (V) is the merged image of A (I), A (II), A (III), and A (IV). (B) represents the process of BBR entering the nucleus. The fluorescence of BBR is shown in green in this figure, and the red arrow points to the nuclear region. All of the images in (B) were taken under the same conditions with a time interval of 1.2 min. (C) represents the fluorescence intensity of BBR in the nucleus. * p<0.05, ** p<0.01 vs control (0 minutes after BBR administration). (D) represents the time-resolution change of berberine in live cells and the nucleus, which was detected by HPLC. (E) represents the chemical structure of BBR. Data were presented as mean ± S.D. from three independent experiments (n = 3).
Figure 3
Figure 3. Interaction between berberine and genetic components.
(A) represents the fluorescence spectrum of BBR (10 µmol) associating with chromatin (15.3 µmol, spectrum 3; 30.6 µmol, spectrum 2; 45.9 µmol, spectrum 1; 0 µmol, spectrum 4); (B) represents the fluorescence spectrum of BBR (10 µmol) associating with plasmid (138.2 µmol, spectrum 1; 92.1 µmol, spectrum 2; 44.6 µmol, spectrum 3; 0 µmol, spectrum 4; spectrum 5 and spectrum 6 represent the fluorescent spectrum of plasmid and buffer, respectively); (C) represents the fluorescence spectrum of BBR (10 µmol) associating with genome (30.8 µmol, spectrum 3; 61.6 µmol, spectrum 2; 92.4 µmol, spectrum 1; 0 µmol, spectrum 4; spectrum 5 represents the fluorescence spectrum of buffer); (D) represents the fluorescence spectrum of tryptophan in chromatin (3.1 µmol) associating with BBR (0 µmol, spectrum 1; 10 µmol, spectrum 2; 20 µmol, spectrum 3; 30 µmol, spectrum 4; spectrum 5 and spectrum 6 represent the fluorescence spectrum of BBR and buffer, respectively). According to (A), (B), and (C), the exciting wavelength is 456 nm and the emission wavelength is 548 nm. The exciting and emission wavelength in (D) is 280 nm and 330 nm, respectively. (E) portrays the isothermal calorimetric measurements revealing the detailed parameters concerning the association of BBR with genomic DNA, chromatin, and plasmid DNA, respectively.
Figure 4
Figure 4. Spatial conformational change induced by berberine.
(A) represents the dose-dependent alterations in circular dichroic spectrum of genome, chromatin, and plasmid, respectively. (B) represents the time-dependent alterations in circular dichroic spectrum of genome, chromatin, and plasmid, respectively. (C) represents the effect of BBR (500 µmol) on the intensity distribution (%) of chromatin (92.4 µmol), genome (423.2 µmol), and plasmid (808 µmol) in size (diameter) obtained from DLS measurements, respectively.
Figure 5
Figure 5. Suppressive effect of BBR on the expression of green fluorescent protein in PC12 cells.
(A) and (B) represent the suppressive effect of BBR on the expression of GFP 12 hours and 24 hours after drug administration, respectively. The value on the x-axis represents the method of drug administration: (1) denotes that BBR has been incubated with PC12 for 1 hour before transfection; (2) denotes that BBR has been incubated with plasmid for 5 minutes before transfection; (3) denotes that BBR was administered 6 hours after transfection; (4) denotes transfection without BBR administration. (C) portrays the method of data collection according to the flow cytometry experiments. C (I), C (II), C (III), and C (IV) represent the method of data collection of PC12 cells without GFP expression, GFP expressing PC12 cells with BBR treatment for 12 hours, GFP expressing PC12 cells with BBR treatment for 24 hours, and GFP expressing PC12 cells without BBR treatment, respectively. The R2 region in the images in (C) characterizes the definition of GFP expressing cells in the cell population. (D) depicts the recovery of GFP expression after the elimination of 12 hour-BBR-treatment (n = 3). (Compared with group 4, * p<0.05, ** p<0.01). Fluorescence intensity =  G×M, where G indicates the number of fluorescent cells and M is the mean fluorescence intensity of fluorescent cells.
Figure 6
Figure 6. The suppressive effect of berberine on gene transcription in live cells.
(A) portrays the time-dependent effect of BBR on gene transcription on a global level. (B) shows the time-dependent recovery of the global RNA level after the elimination of a 12 hour-BBR treatment. The linear equation of the control group in (B) is: y = 4.9836×+21.516, R2 = 0.8162; the linear equation of the BBR group in (B)is: y = 6.6219×+15.472, R2 = 0.8941. (C) displays the protective effect of BBR on the global RNA level. (D) depicts the protective effect of BBR on the mRNA level of the transfected artificial plasmid, pEGFP-N1. The dosage of BBR in all of the experiments was 2.69 µmol. Data in D was the ratio of target gene in the BBR group to the same target gene in the BBR-free group at the same time-point (control group). * p<0.05, ** p<0.01 vs the corresponding control indicated above. Data were presented as mean ± S.D. from four independent experiments (n = 4).
Figure 7
Figure 7. The suppressive effect of BBR on the transcription of artificial plasmids.
A (I) and A (II) signify the type of artificial plasmid model used in this study. (B), (C), (D), (E), and (F) represent the effect of BBR on CMV-GFP, PPARγ-GFP, IgG-GFP, CMV-RFP, and TPH2-RFP plasmids, respectively. (G) illustrates the suppressive effect of BBR on the expression of these five plasmids 1 hour after drug administration. Data is the ratio of the target gene in the BBR group to the same target gene in the BBR-free group at the same time-point (control group) * p<0.05, ** p<0.01 vs the corresponding control indicated above. Data were presented as mean ± S.D, from three independent experiments (n = 3).
Figure 8
Figure 8. The association of BBR with DNA can suppress the interaction between TBP and the TATA box.
(A) represents the suppressive effect of BBR on gene transcription in a cell-free system, where actinomycin D (AD) was used as the positive control drug because of its well-known transcription inhibitory activity. (B) represents the suppressive effect of BBR on the association between TBP and the TATA box. B (I) is an image taken via EMSA, and B (II) represents the effect of BBR on the binding of TBP to TATA box, (y = 11.468×, ln-(x)+.60.55, R2 = 0.9344, n = 3. (C) represents the time-dependent suppressive effect of BBR (2.69 µmol) on the interaction between TBP and the TATA box in live cells observed using ChIP. C (I) is one of the images taken from a Western blot representing TBP, and C (II) displays the statistical results of brightness of TBP in Western blot images from three independent experiments. C (III) and C (IV) depict the quantitative analysis of the TATA box-containing DNA fragment in the CMV promoter and PPARγ promoter bound by TBP from four independent experiments, the data of which was represented as the ratio of the content of DNA fragments in BBR groups to the content in BBR-free groups at the same time-point (control group), input of each sample was used as inner reference. * P<0.05, ** p<0.01 vs the corresponding control indicated above. Data were presented as mean ± S.D, from three independent experiments (n = 3).

References

    1. Kuo CL, Chi CW, Liu TY. The anti-inflammatory potential of berberine in vitro and in vivo. Cancer Lett. 2004;203(2):127–137. - PubMed
    1. Xu LH, Liu L, He XH. Inhibitory effects of berberine on the activation and cell cycle progression of human peripheral lymphocytes. Cellular and molecular immunology. 2005;2(4):295–300. - PubMed
    1. Yin J, Xing HL, Ye JP. Efficacy of berberine in patients with type 2 diabetes mellitus. Metabolism Clinical and Experimental. 2008;57(5):712–717. - PMC - PubMed
    1. Zhou XQ, Zeng XN, Kong H, Sun XL. Neuroprotective effects of berberine on stroke models in vitro and in vivo. Neurosci Lett. 2008;447(1):31–36. - PubMed
    1. Bova S, Padrini R, Goldman WF, Berman DM, Cargnelli G. On the mechanism of vasodilating action of berberine: possible roleof inositol lipid signaling system. J Pharmacol Exp Ther. 1992;261(1):318–323. - PubMed

Publication types

MeSH terms

LinkOut - more resources