

Reverse effect of mammalian hypocalcemic cortisol in fish: cortisol stimulates Ca2+ uptake via glucocorticoid receptor-mediated vitamin D3 metabolism
- PMID: 21887296
- PMCID: PMC3161063
- DOI: 10.1371/journal.pone.0023689
Reverse effect of mammalian hypocalcemic cortisol in fish: cortisol stimulates Ca2+ uptake via glucocorticoid receptor-mediated vitamin D3 metabolism
Abstract
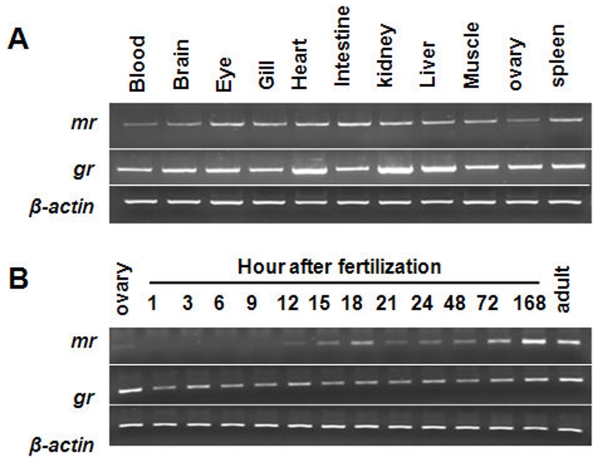
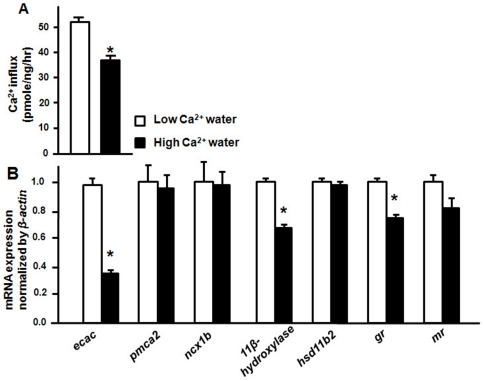
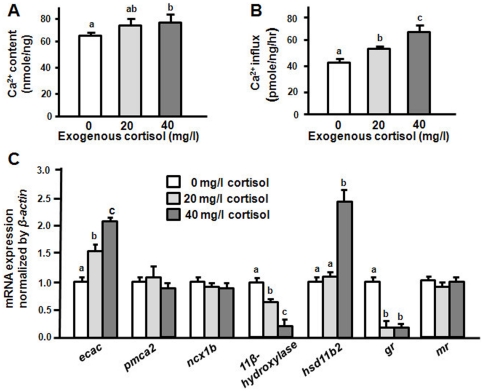
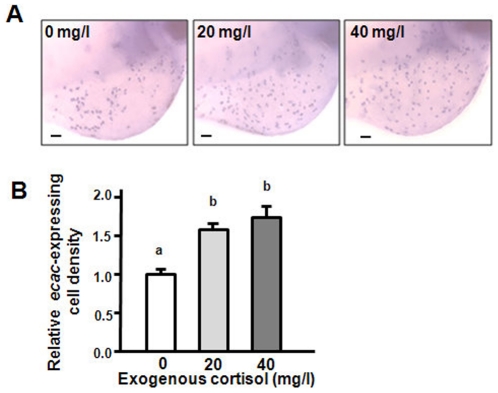
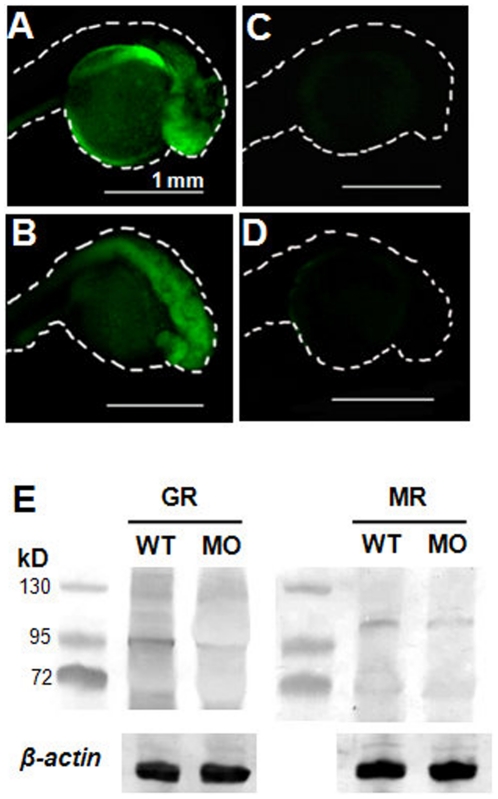
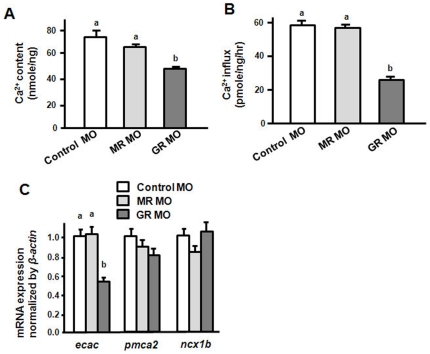
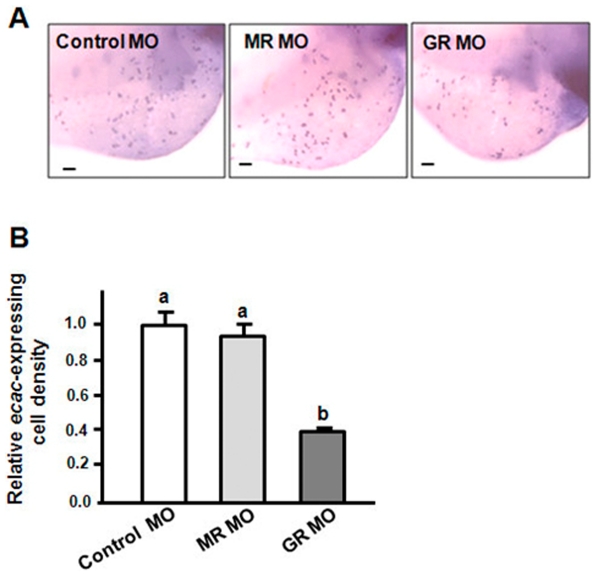
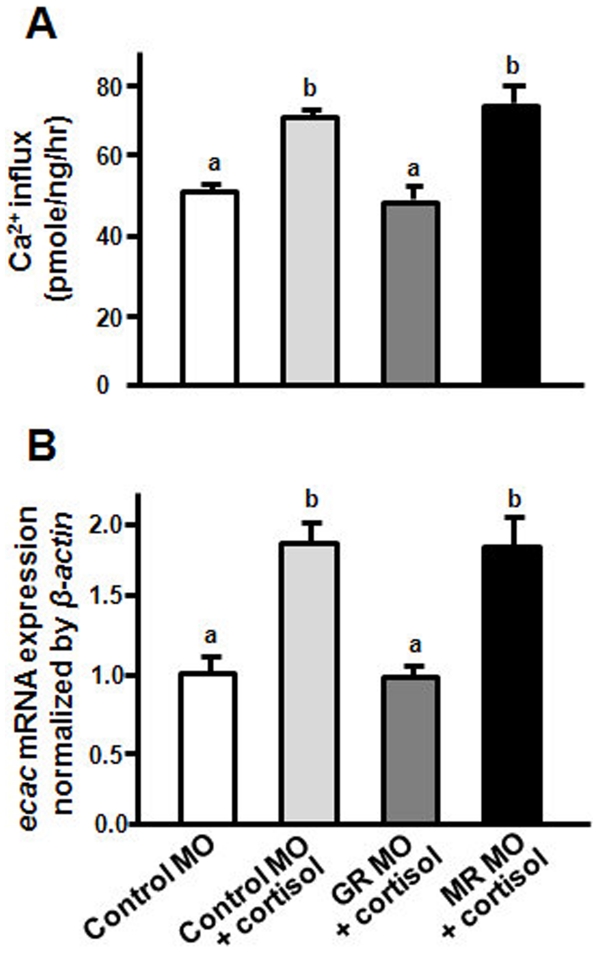
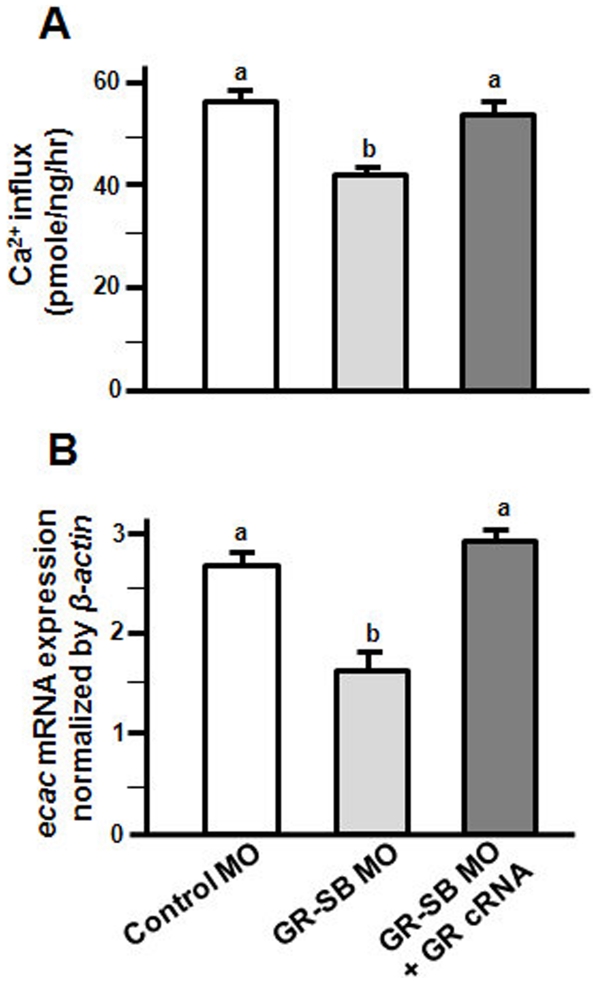
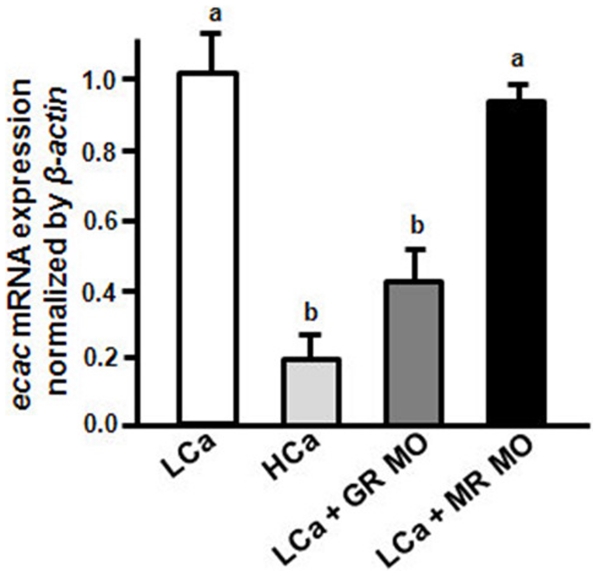
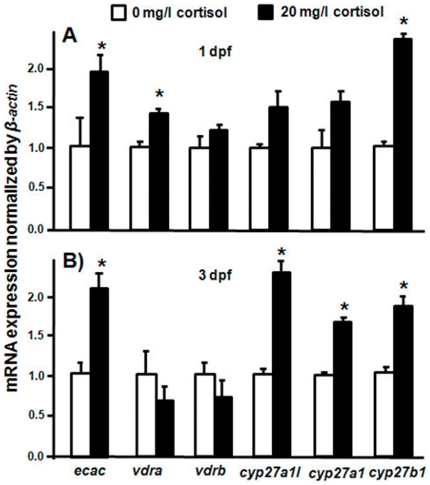
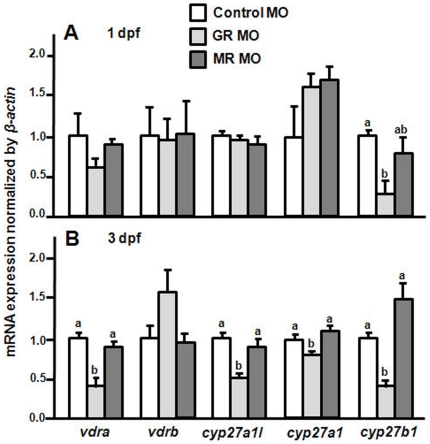
Cortisol was reported to downregulate body-fluid Ca(2+) levels in mammals but was proposed to show hypercalcemic effects in teleostean fish. Fish, unlike terrestrial vertebrates, obtain Ca(2+) from the environment mainly via the gills and skin rather than by dietary means, and have to regulate the Ca(2+) uptake functions to cope with fluctuating Ca(2+) levels in aquatic environments. Cortisol was previously found to regulate Ca(2+) uptake in fish; however, the molecular mechanism behind this is largely unclear. Zebrafish were used as a model to explore this issue. Acclimation to low-Ca(2+) fresh water stimulated Ca(2+) influx and expression of epithelial calcium channel (ecac), 11β-hydroxylase and the glucocorticoid receptor (gr). Exogenous cortisol increased Ca(2+) influx and the expressions of ecac and hydroxysteroid 11-beta dehydrogenase 2 (hsd11b2), but downregulated 11β-hydroxylase and the gr with no effects on other Ca(2+) transporters or the mineralocorticoid receptor (mr). Morpholino knockdown of the GR, but not the MR, was found to impair zebrafish Ca(2+) uptake function by inhibiting the ecac expression. To further explore the regulatory mechanism of cortisol in Ca(2+) uptake, the involvement of vitamin D(3) was analyzed. Cortisol stimulated expressions of vitamin D-25hydroxylase (cyp27a1), cyp27a1 like (cyp27a1l), 1α-OHase (cyp27b1) at 3 dpf through GR, the first time to demonstrate the relationship between cortisol and vitamin D(3) in fish. In conclusion, cortisol stimulates ecac expression to enhance Ca(2+) uptake functions, and this control pathway is suggested to be mediated by the GR. Lastly, cortisol also could mediate vitamin D(3) signaling to stimulate Ca(2+) uptake in zebrafish.
Conflict of interest statement
Figures
Similar articles
-
Environmental and cortisol-mediated control of Ca(2+) uptake in tilapia (Oreochromis mossambicus).J Comp Physiol B. 2016 Apr;186(3):323-32. doi: 10.1007/s00360-016-0963-7. Epub 2016 Feb 8. J Comp Physiol B. 2016. PMID: 26857273 Free PMC article.
-
Action of vitamin D and the receptor, VDRa, in calcium handling in zebrafish (Danio rerio).PLoS One. 2012;7(9):e45650. doi: 10.1371/journal.pone.0045650. Epub 2012 Sep 19. PLoS One. 2012. PMID: 23029160 Free PMC article.
-
Glucocorticoid receptor, but not mineralocorticoid receptor, mediates cortisol regulation of epidermal ionocyte development and ion transport in zebrafish (danio rerio).PLoS One. 2013 Oct 29;8(10):e77997. doi: 10.1371/journal.pone.0077997. eCollection 2013. PLoS One. 2013. PMID: 24205060 Free PMC article.
-
Evolution of hormone selectivity in glucocorticoid and mineralocorticoid receptors.J Steroid Biochem Mol Biol. 2013 Sep;137:57-70. doi: 10.1016/j.jsbmb.2013.07.009. Epub 2013 Jul 29. J Steroid Biochem Mol Biol. 2013. PMID: 23907018 Review.
-
The Control of Calcium Metabolism in Zebrafish (Danio rerio).Int J Mol Sci. 2016 Oct 26;17(11):1783. doi: 10.3390/ijms17111783. Int J Mol Sci. 2016. PMID: 27792163 Free PMC article. Review.
Cited by
-
Stanniocalcin-1 controls ion regulation functions of ion-transporting epithelium other than calcium balance.Int J Biol Sci. 2015 Jan 1;11(2):122-32. doi: 10.7150/ijbs.10773. eCollection 2015. Int J Biol Sci. 2015. PMID: 25561895 Free PMC article.
-
Environmental and cortisol-mediated control of Ca(2+) uptake in tilapia (Oreochromis mossambicus).J Comp Physiol B. 2016 Apr;186(3):323-32. doi: 10.1007/s00360-016-0963-7. Epub 2016 Feb 8. J Comp Physiol B. 2016. PMID: 26857273 Free PMC article.
-
Cortisol Regulates Acid Secretion of H(+)-ATPase-rich Ionocytes in Zebrafish (Danio rerio) Embryos.Front Physiol. 2015 Nov 17;6:328. doi: 10.3389/fphys.2015.00328. eCollection 2015. Front Physiol. 2015. PMID: 26635615 Free PMC article.
-
The role of cAMP-mediated intracellular signaling in regulating Na+ uptake in zebrafish larvae.Am J Physiol Regul Integr Comp Physiol. 2014 Jan 1;306(1):R51-60. doi: 10.1152/ajpregu.00317.2013. Epub 2013 Nov 20. Am J Physiol Regul Integr Comp Physiol. 2014. PMID: 24259461 Free PMC article.
-
Sox10 is required for systemic initiation of bone mineralization.Development. 2025 Jan 15;152(2):dev204357. doi: 10.1242/dev.204357. Epub 2025 Jan 20. Development. 2025. PMID: 39791977 Free PMC article.
References
-
- Charmandari E, Tsigos C, Chrousos G. Endocrinology of the stress response. Ann Rev Physiol. 2005;67:259–284. - PubMed
-
- McLaughlin F, Mackintosh J, Hayes BP, McLaren A, Uings IJ, et al. Glucocorticoid-induced osteopenia in the mouse as assessed by histomorphometry, microcomputed tomography, and biochemical markers. Bone. 2002;30:924–930. - PubMed
-
- Patschan D, Loddenkemper K, Buttgereit F. Molecular mechanisms of glucocorticoid -induced osteoporosis. Bone. 2001;29:498–505. - PubMed
-
- Lukert BP, Raisz LG. Glucocorticoid-induced osteoporosis: pathogenesis and management. Ann Intern Med. 1990;112:352–364. - PubMed
-
- Huybers S, Naber TH, Bindels RJ, Hoenderop JG. Prednisolone-induced Ca2+ malabsorption is caused by diminished expression of the epithelial Ca2+ channel TRPV6. Am J Physiol Gastrointest Liver Physiol. 2007;292(1):G92–97. - PubMed
Publication types
MeSH terms
Substances
LinkOut - more resources
Full Text Sources
Molecular Biology Databases
Miscellaneous
