

Identification and characterization of alternative promoters, transcripts and protein isoforms of zebrafish R2 gene
- PMID: 21887375
- PMCID: PMC3161108
- DOI: 10.1371/journal.pone.0024089
Identification and characterization of alternative promoters, transcripts and protein isoforms of zebrafish R2 gene
Abstract
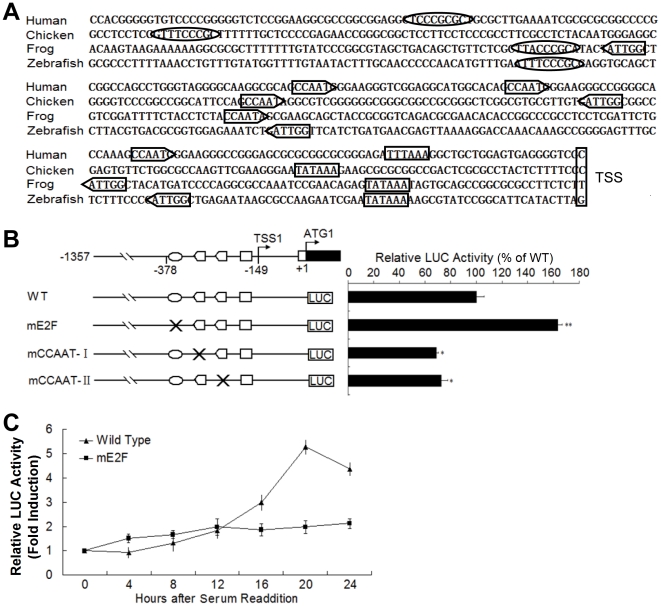
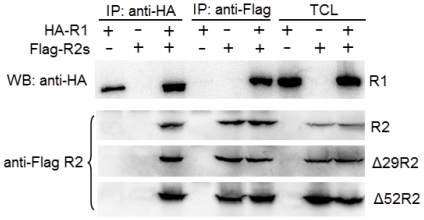
Ribonucleotide reductase (RNR) is the rate-limiting enzyme in the de novo synthesis of deoxyribonucleoside triphosphates. Expression of RNR subunits is closely associated with DNA replication and repair. Mammalian RNR M2 subunit (R2) functions exclusively in DNA replication of normal cells due to its S phase-specific expression and late mitotic degradation. Herein, we demonstrate the control of R2 expression through alternative promoters, splicing and polyadenylation sites in zebrafish. Three functional R2 promoters were identified to generate six transcript variants with distinct 5' termini. The proximal promoter contains a conserved E2F binding site and two CCAAT boxes, which are crucial for the transcription of R2 gene during cell cycle. Activity of the distal promoter can be induced by DNA damage to generate four transcript variants through alternative splicing. In addition, two novel splice variants were found to encode distinct N-truncated R2 isoforms containing residues for enzymatic activity but no KEN box essential for its proteolysis. These two N-truncated R2 isoforms remained in the cytoplasm and were able to interact with RNR M1 subunit (R1). Thus, our results suggest that multilayered mechanisms control the differential expression and function of zebrafish R2 gene during cell cycle and under genotoxic stress.
Conflict of interest statement
Figures


Similar articles
-
S Phase-specific transcription of the mouse ribonucleotide reductase R2 gene requires both a proximal repressive E2F-binding site and an upstream promoter activating region.J Biol Chem. 2004 Mar 12;279(11):10796-807. doi: 10.1074/jbc.M312482200. Epub 2003 Dec 19. J Biol Chem. 2004. PMID: 14688249
-
Controlled protein degradation regulates ribonucleotide reductase activity in proliferating mammalian cells during the normal cell cycle and in response to DNA damage and replication blocks.J Biol Chem. 2000 Jun 9;275(23):17747-53. doi: 10.1074/jbc.M000799200. J Biol Chem. 2000. PMID: 10747958
-
Stable suppression of the R2 subunit of ribonucleotide reductase by R2-targeted short interference RNA sensitizes p53(-/-) HCT-116 colon cancer cells to DNA-damaging agents and ribonucleotide reductase inhibitors.J Biol Chem. 2004 Jun 25;279(26):27030-8. doi: 10.1074/jbc.M402056200. Epub 2004 Apr 19. J Biol Chem. 2004. PMID: 15096505
-
Ribonucleotide reductase: regulation, regulation, regulation.Trends Biochem Sci. 1992 Mar;17(3):119-23. doi: 10.1016/0968-0004(92)90249-9. Trends Biochem Sci. 1992. PMID: 1412696 Review.
-
Function and regulation of yeast ribonucleotide reductase: cell cycle, genotoxic stress, and iron bioavailability.Biomed J. 2013 Mar-Apr;36(2):51-8. doi: 10.4103/2319-4170.110398. Biomed J. 2013. PMID: 23644233 Review.
Cited by
-
Gene2DGE: a Perl package for gene model renewal with digital gene expression data.Genomics Proteomics Bioinformatics. 2012 Feb;10(1):51-4. doi: 10.1016/S1672-0229(11)60033-8. Genomics Proteomics Bioinformatics. 2012. PMID: 22449401 Free PMC article.
-
Differential actinodin1 regulation in embryonic development and adult fin regeneration in Danio rerio.PLoS One. 2019 May 2;14(5):e0216370. doi: 10.1371/journal.pone.0216370. eCollection 2019. PLoS One. 2019. PMID: 31048899 Free PMC article.
-
A cyclin without cyclin-dependent kinases: cyclin F controls genome stability through ubiquitin-mediated proteolysis.Trends Cell Biol. 2013 Mar;23(3):135-40. doi: 10.1016/j.tcb.2012.10.011. Epub 2012 Nov 19. Trends Cell Biol. 2013. PMID: 23182110 Free PMC article. Review.
-
NF-Y activates genes of metabolic pathways altered in cancer cells.Oncotarget. 2016 Jan 12;7(2):1633-50. doi: 10.18632/oncotarget.6453. Oncotarget. 2016. PMID: 26646448 Free PMC article.
References
-
- Nordlund N, Reichard P. Ribonucleotide reductases. Annual Review of Biochemistry. 2006;75:681–706. - PubMed
-
- Mathews CK. DNA precursor metabolism and genomic stability. FASEB J. 2006;20:1300–1314. - PubMed
-
- Elledge SJ, Davis RW. Two genes differentially regulated in the cell cycle and by DNA-damaging agents encode alternative regulatory subunits of ribonucleotide reductase. Genes Dev. 1990;4:740–751. - PubMed
-
- Domkin V, Thelander L, Chabes A. Yeast DNA damage-inducible Rnr3 has a very low catalytic activity strongly stimulated after the formation of a cross-talking Rnr1/Rnr3 complex. J Biol Chem. 2002;277:18574–18578. - PubMed
Publication types
MeSH terms
Substances
LinkOut - more resources
Full Text Sources
Molecular Biology Databases
