. 2011;6(8):e24149.
doi: 10.1371/journal.pone.0024149. Epub 2011 Aug 26.

Myosin IIb activity and phosphorylation status determines dendritic spine and post-synaptic density morphology

Affiliations

Myosin IIb activity and phosphorylation status determines dendritic spine and post-synaptic density morphology

Jennifer L Hodges et al. PLoS One. 2011.

Abstract

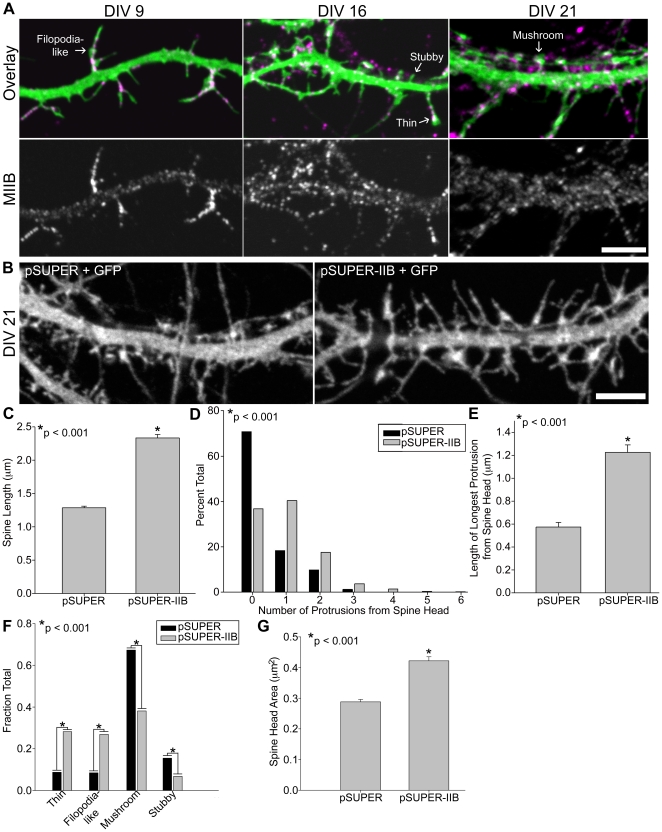
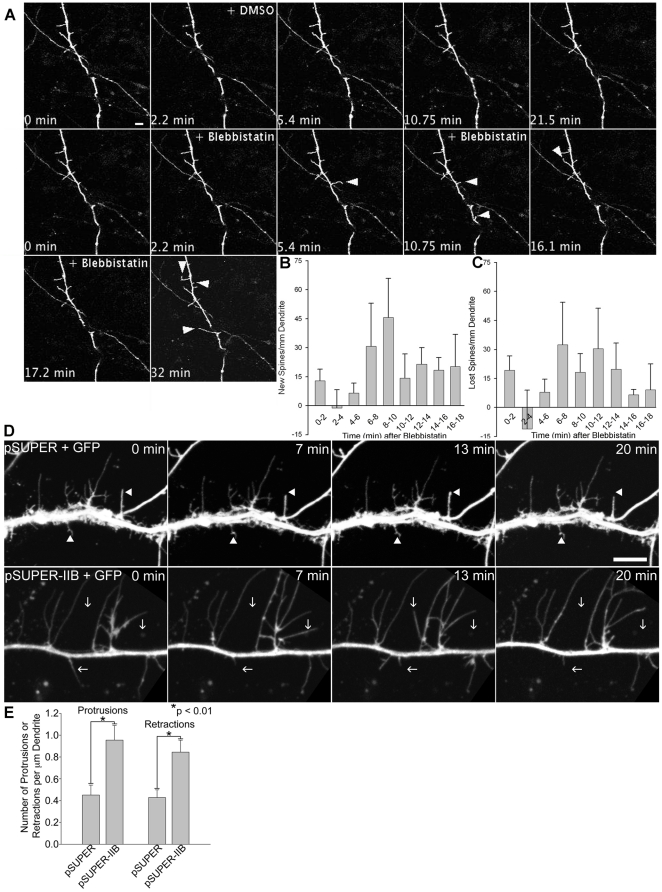
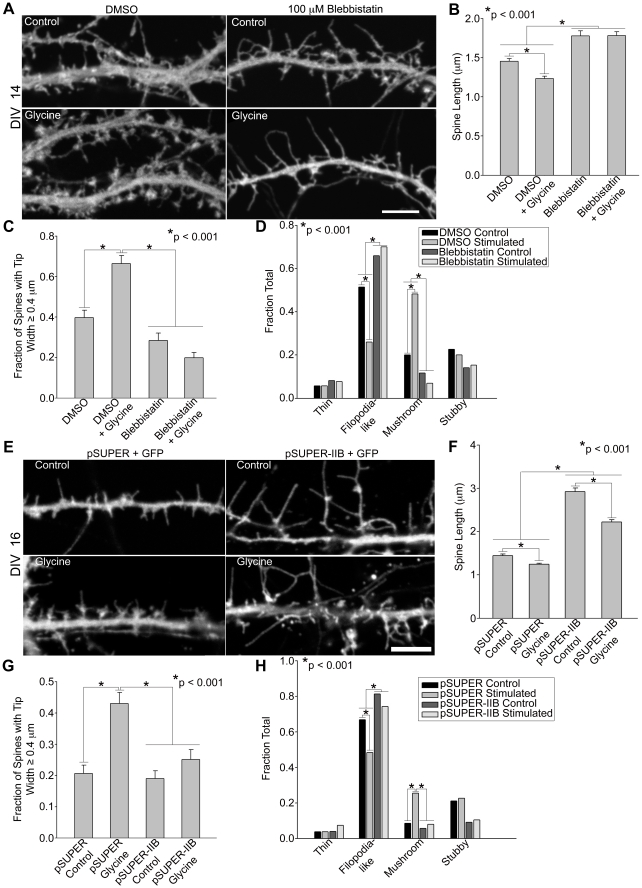
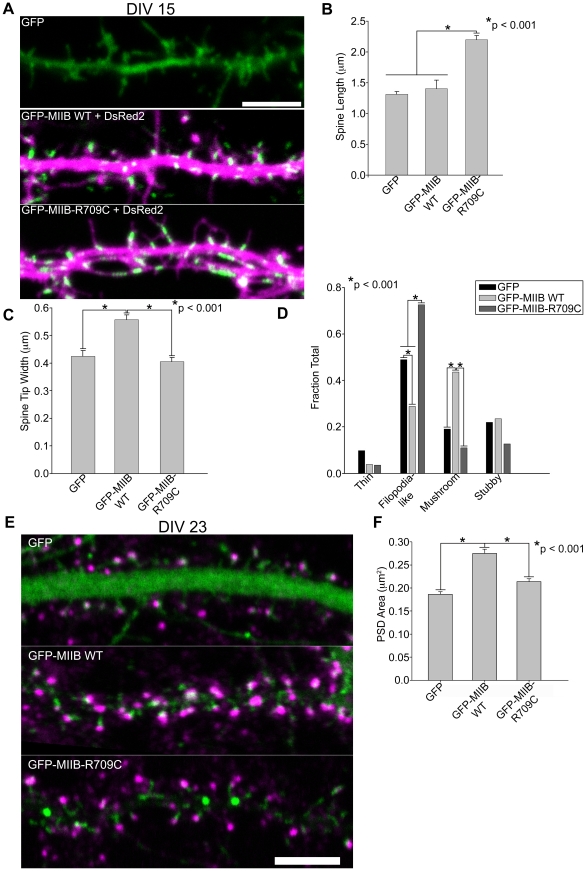
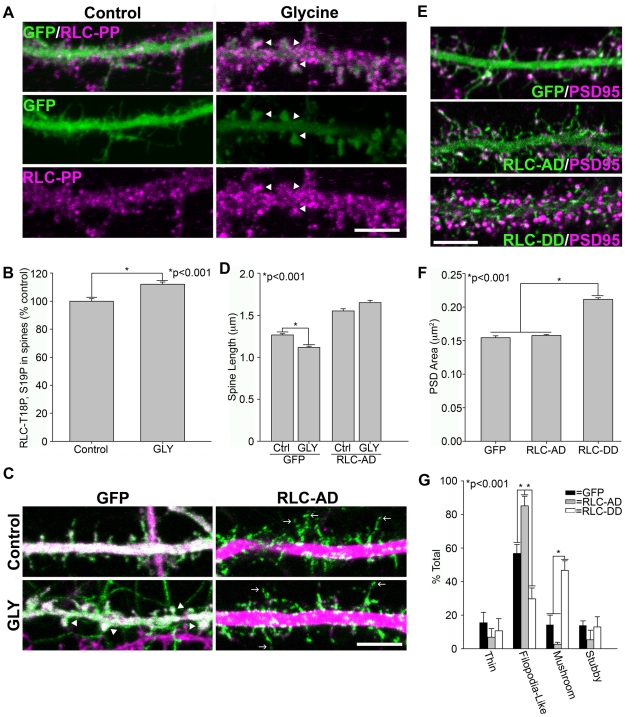
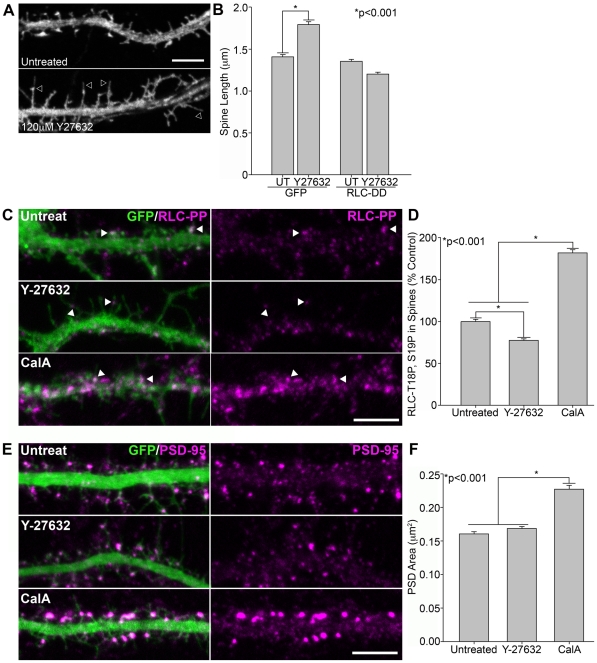
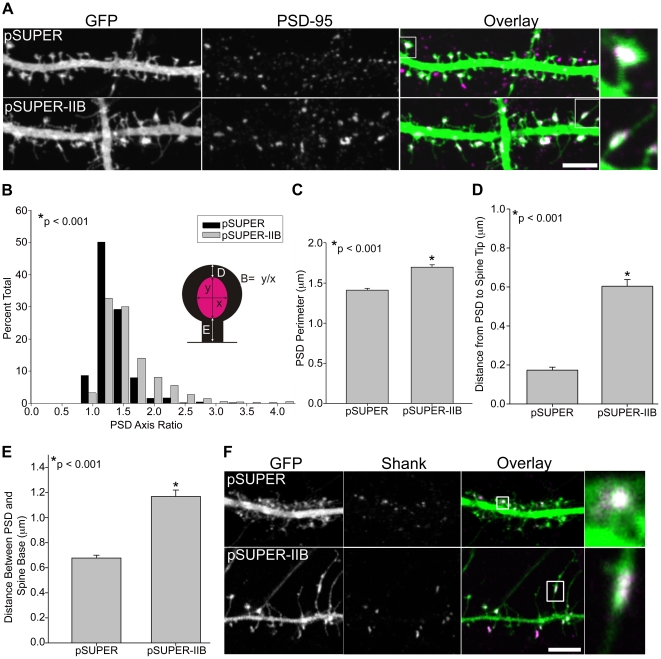
Dendritic spines in hippocampal neurons mature from a filopodia-like precursor into a mushroom-shape with an enlarged post-synaptic density (PSD) and serve as the primary post-synaptic location of the excitatory neurotransmission that underlies learning and memory. Using myosin II regulatory mutants, inhibitors, and knockdowns, we show that non-muscle myosin IIB (MIIB) activity determines where spines form and whether they persist as filopodia-like spine precursors or mature into a mushroom-shape. MIIB also determines PSD size, morphology, and placement in the spine. Local inactivation of MIIB leads to the formation of filopodia-like spine protrusions from the dendritic shaft. However, di-phosphorylation of the regulatory light chain on residues Thr18 and Ser19 by Rho kinase is required for spine maturation. Inhibition of MIIB activity or a mono-phosphomimetic mutant of RLC similarly prevented maturation even in the presence of NMDA receptor activation. Expression of an actin cross-linking, non-contractile mutant, MIIB R709C, showed that maturation into a mushroom-shape requires contractile activity. Loss of MIIB also leads to an elongated PSD morphology that is no longer restricted to the spine tip; whereas increased MIIB activity, specifically through RLC-T18, S19 di-phosphorylation, increases PSD area. These observations support a model whereby myosin II inactivation forms filopodia-like protrusions that only mature once NMDA receptor activation increases RLC di-phosphorylation to stimulate MIIB contractility, resulting in mushroom-shaped spines with an enlarged PSD.


Conflict of interest statement

Competing Interests: The authors have declared that no competing interests exist.

Figures

Figure 1
Figure 1. Inhibition of myosin IIB activity increases the number and length of filopodia-like protrusions.
A) Hippocampal neurons transfected with GFP at DIV 6 were fixed and immunostained for endogenous MIIB at DIV 9, 16, and 21. Arrows point to different spine morphology types. B) Hippocampal neurons were co-transfected at DIV 6 with GFP and either an shRNA vector against MIIB (pSUPER-IIB) or a control empty vector (pSUPER). Neurons were fixed at DIV 21 and scored for (C–G) changes in spine length, branching number and length, morphology and head area. Knockdown of MIIB in hippocampal neurons causes a ∼2-fold increase in spine length, C. Knockdown of MIIB causes a large increase in the number of protrusions branching from the spine head. Spine heads were identified by morphology and localization of PSD-95. Note the small fraction of spines that contain protrusions branching from the spine head in the controls, D. MIIB knockdown produces many long protrusions branching from the spine head, which results in spine head positioning away from the spine tip, E. MIIB knockdown creates an increase in the fraction of thin (long protrusions with small head at tip) and filopodia-like spines (long protrusions without a spine head) with a concomitant decrease in the fraction of mushroom and stubby spines, F. Spine heads present in MIIB knockdown neurons are larger in area, G. For each quantification, 512 spines from 23 control neurons and 619 spines from 36 MIIB knockdown neurons were analyzed. Error bars represent SEM. p-values were derived using the Mann-Whitney test (C, D, E, G) and Chi-square test (F). Scale bar = 5 µm for all panels.
Figure 2
Figure 2. Inhibition of myosin IIB activity affects spine dynamics.
A) A DIV 7 cortical neuron expressing DsRed2 was locally micropipetted with either DMSO or 100 µM blebbistatin at the indicated times. Note the increase in the fraction of spines that appear and extend in response to blebbistatin. Arrowheads indicate either nascent or elongating spines as shown in Video S1. Scale bar = 5 µm. B–C) Quantification of new spine formation (B) or loss of spines (C) following blebbistatin micropipetting (micropipetting of 5 different cortical neurons). The number of new or lost spines is corrected for the number of new or lost spines observed prior to micropipetting, i.e. the control period. D–E) Time-lapse confocal imaging was performed on DIV 13–14 hippocampal neurons co-expressing GFP and either an shRNA vector against MIIB or a control empty vector. Scale bar = 5 µm. Spines from MIIB knockdown neurons extend and retract more frequently (arrows) than spines in control neurons (arrowheads), D. MIIB knockdown increases the frequency of spine protrusion and retraction, E. Note the unusual length of the protrusions in the MIIB knockdown neurons. Quantification in (E) is based on 3 MIIB knockdown neurons and 5 control neurons each acquired for 15 minutes. Error bars represent SEM. *p<0.01, Mann-Whitney test.
Figure 3
Figure 3. Inhibition of myosin IIB activity prevents spine morphological changes in response to NMDA receptor activation.
A, E) When MIIB is inhibited using blebbistatin (A) or MIIB knockdown (E), spines do not shorten or assume a “mushroom” morphology in response to glycine. Hippocampal neurons were transfected on DIV 6 with GFP or co-transfected with GFP and either an shRNA vector against MIIB or a control empty vector. Neurons were treated with glycine on DIV14 (in the presence of DMSO or blebbistatin, A) or DIV16 (MIIB knockdown or empty vector control, E) to activate NMDA receptors. BD, F–H) Quantification of spine morphology in response to MIIB inhibition and glycine stimulation. Blebbistatin (B) or MIIB knockdown (F) prevents spine shortening in response to glycine stimulation and increases spine length compared to controls; note some decrease in spine length in the knockdown in response to glycine. Fraction of spines with a large head, spine tip width ≥ 0.4 µm, increases in response to glycine stimulation but is prevented by blebbistatin (C) or MIIB knockdown (G). In the presence of blebbistatin (D) or MIIB knockdown (H), glycine does not increase the fraction of mushroom-shaped spines in contrast to stimulated controls. For each condition, 530–895 spines from 15–21 neurons were analyzed. Error bars represent SEM. *p<0.001, Mann-Whitney test (B, F), t-test (C, G), Chi-square test (D, H). Scale bar = 5 µm for all panels.
Figure 4
Figure 4. Myosin contractility promotes spine maturation.
A) Hippocampal neurons were co-transfected at DIV 6 with DsRed2 and either GFP, GFP-MIIB WT (wild type), or GFP-MIIB-R709C (an actin-binding but contractile-deficient mutant) and fixed at DIV 14 or 15. Note the increased length of the non-contractile mutant and increase in mushroom-shaped spines in the cells expressing ectopic MIIB. B–D) Spine length, measured via DsRed2, is significantly longer in neurons expressing GFP-MIIB-R709C but is not different between GFP control and neurons expressing GFP-MIIB WT, B. Spine head width, visualized using cytoplasmic DsRed2, is greater in neurons expressing GFP-MIIB WT; but there is no difference in the spine head width of neurons expressing GFP-IIB-R709C and GFP control neurons, C. The fraction of mushroom shaped spines is greater in neurons expressing GFP-MIIB WT; whereas the fraction of filopodia-like spines is greater in neurons expressing GFP-MIIB-R709C, D. E–F) The PSD area increases in DIV 21–23 neurons expressing WT-MIIB, but not in the controls or neurons expressing R709C. For each condition, 424–582 spines from 6–15 neurons were analyzed. Error bars represent SEM. *p<0.001, Mann-Whitney test (B, C, F), Chi-square test (D). Scale bar = 5 µm for all panels.
Figure 5
Figure 5. RLC T18, S19 di-phosphorylation mediates spine maturation.
A) Glycine-activation of NMDA receptors stimulates spine maturation and increases RLC-T18, S19 di-phosphorylation in spines (arrowheads indicate increased RLC-T18, S19 ∼P in glycine-stimulated spines). DIV 21 neurons expressing GFP were chronically treated with the NMDA receptor antagonist AP-5 to inhibit spine maturation. Neurons were acutely stimulated by AP-5 withdrawal and the addition of 200 µM glycine, while control neurons were continuously treated with AP-5. B) Quantification of spine-associated RLC-T18, S19 di-phosphorylation by staining reveals a significant increase following NMDA receptor activation. 706 spines from 7 neurons were analyzed for AP5 controls and 843 spines from 8 glycine stimulated neurons. C) RLC-AD inhibits spine maturation in response to glycine activation of NMDA receptors. DIV 21 neurons were treated as described in (A) and immunostained for the dendrite marker, MAP-2 (magenta). D) RLC-AD prevents spine shortening in response to glycine (4C, arrows). We analyzed 2032 spines from 12 AP-5-treated GFP neurons, 1698 spines from 15 glycine stimulated GFP neurons, 1017 spines from 7 AP-5-treated RLC-AD neurons, 1116 spines from 8 glycine-stimulated RLC-AD neurons. E) RLC-AD expression creates filopodia-like spine precursors, while RLC-DD contracts spines into a mushroom-shaped morphology with increased PSD area. Neurons between DIV 21–33 expressing either GFP, RLC-AD GFP or RLC-DD GFP were fixed and immunostained for the PSD marker, PSD-95. F) RLC-DD significantly increases PSD area in comparison to GFP or RLC-AD. PSD measurements are from neurons between DIV 21–33. We analyzed 442 PSDs from 4 GFP neurons, 2204 PSDs from 16 RLC-AD neurons, and 2167 PSDs from 15 RLC-DD neurons. G) RLC-DD expression increases the percentage of mushroom-shape spines, while RLC-AD increases the percentage of filopodia-like spines. Spine morphology distribution of a representative culture is shown. Error bars represent SEM. *p<0.001, Mann Whitney test (B,D,F), t-test (G). Scale bar = 5 µm for all panels.
Figure 6
Figure 6. ROCK regulates spine morphology through RLC-T18, S19 di-phosphorylation.
A) ROCK inhibition (Y-27632) produces filopodia-like spines (arrowheads). DIV14 neurons expressing GFP were treated with 120 µM Y-27632 for 2 hours or left untreated as a control. B) RLC-DD prevents the increase in spine length with Y-27632 We analyzed 1199 spines from 13 GFP untreated neurons, 1056 spines from 9 GFP neurons treated with Y-27632, 1142 spines from 6 RLC-DD untreated neurons, and 809 spines from 8 RLC-DD neurons treated with Y-27632. C) Y-27632 decreases endogenous RLC-T18, S19 di-phosphorylation concomitant with the formation of filopodia-like spines. In contrast, inhibition of myosin light chain phosphatase with calyculin A (CalA), increases RLC-T18, S19 di-phosphorylation. Arrowheads indicate spine-associated RLC-PP. Neurons were treated with 100 µM Y-27632 for 2 hours or 20nM calyculin A for 20min or left untreated. D) Y-27632 decreases the levels of spine-associated RLC-PP staining; whereas calyculin A increases it. We analyzed 855 spines from 10 untreated neurons, 901 spines from 9 Y-27632-treated neurons, and 989 spines from 9 calyculin A-treated neurons. E–F) Calyculin A increases PSD area in comparison with untreated or Y-27632-treated neurons. Neurons were treated as in C. We analyzed 499 PSDs from 10 untreated neurons, 519 PSDs from 9 Y-27632-treated neurons, and 452 PSDs from calyculin A-treated neurons. Error bars represent SEM. *p<0.001, Mann-Whitney test. Scale bar = 5 µm.
Figure 7
Figure 7. Myosin IIB regulates post-synaptic density morphology.
A) Myosin IIB knockdown alters PSD morphology and positioning. Hippocampal neurons were co-transfected on DIV 6 with GFP and either an shRNA vector against MIIB or a control empty vector and fixed and immunostained for endogenous PSD-95 at DIV 21. B) The PSD axis ratio (B) is expressed as the long axis (y) of each PSD divided by the short axis (x). The PSD axis ratio is significantly greater in neurons with MIIB knocked down. C) shRNA knockdown of MIIB increases the PSD perimeter. D) Distance from PSD-95 to the spine tip (D in diagram) is significantly greater in neurons with MIIB knocked down. E) Distance from PSD-95 to the spine base (E in diagram) is significantly greater in neurons with MIIB knocked down. For each condition, 524–738 spines of 10–14 neurons were analyzed. F) Immunostaining for Shank confirms the elongated PSD morphology in response to MIIB knockdown. Error bars represent SEM. *p<0.001, Mann-Whitney test. Scale bar = 5 µm.

References

    1. Bourne JN, Harris KM. Balancing structure and function at hippocampal dendritic spines. Annu Rev Neurosci. 2008;31:47–67. - PMC - PubMed
    1. Sekino Y, Kojima N, Shirao T. Role of actin cytoskeleton in dendritic spine morphogenesis. Neurochem Int. 2007;51:92–104. - PubMed
    1. Yuste R, Bonhoeffer T. Genesis of dendritic spines: insights from ultrastructural and imaging studies. Nat Rev Neurosci. 2004;5:24–34. - PubMed
    1. Peng J, Kim MJ, Cheng D, Duong DM, Gygi SP, et al. Semiquantitative proteomic analysis of rat forebrain postsynaptic density fractions by mass spectrometry. J Biol Chem. 2004;279:21003–21011. - PubMed
    1. Sheng M, Hoogenraad CC. The Postsynaptic Architecture of Excitatory Synapses: A More Quantitative View. Annual Review of Biochemistry. 2007;76:823–847. - PubMed

MeSH terms

Substances