Comparative Study
. 2011 Sep 7;101(5):1046-56.
doi: 10.1016/j.bpj.2011.07.036.

Similar endothelial glycocalyx structures in microvessels from a range of mammalian tissues: evidence for a common filtering mechanism?

Affiliations
Comparative Study

Similar endothelial glycocalyx structures in microvessels from a range of mammalian tissues: evidence for a common filtering mechanism?

K P Arkill et al. Biophys J. .

Abstract

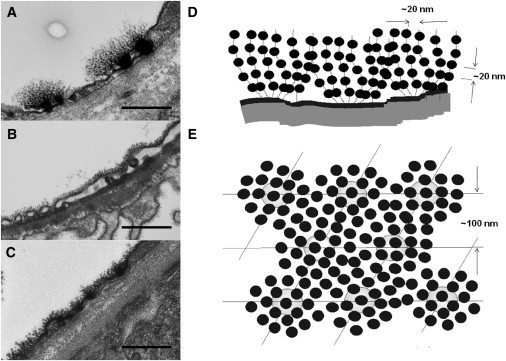
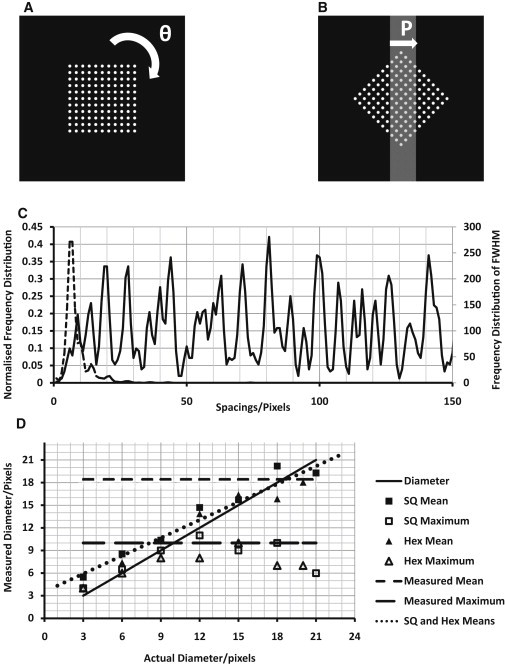
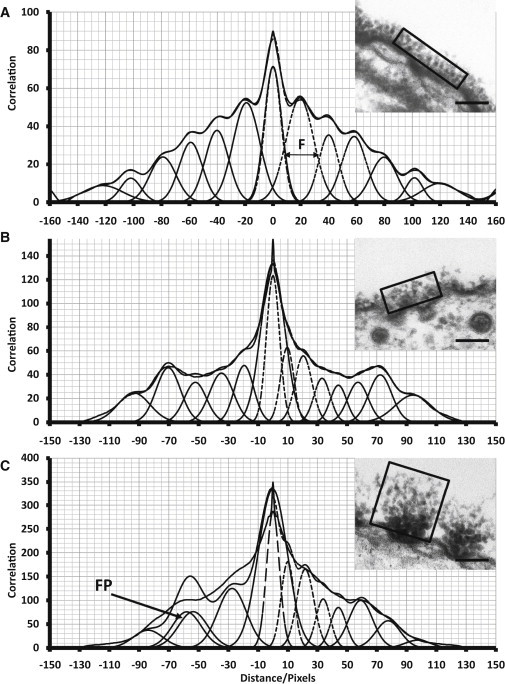
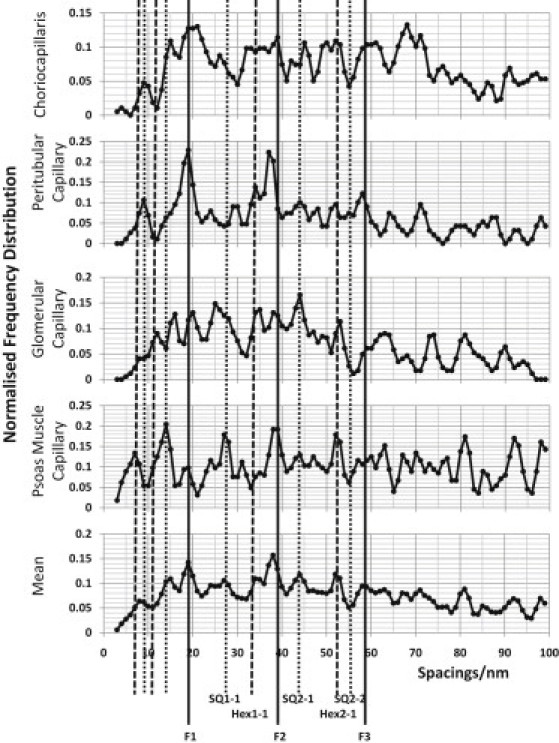
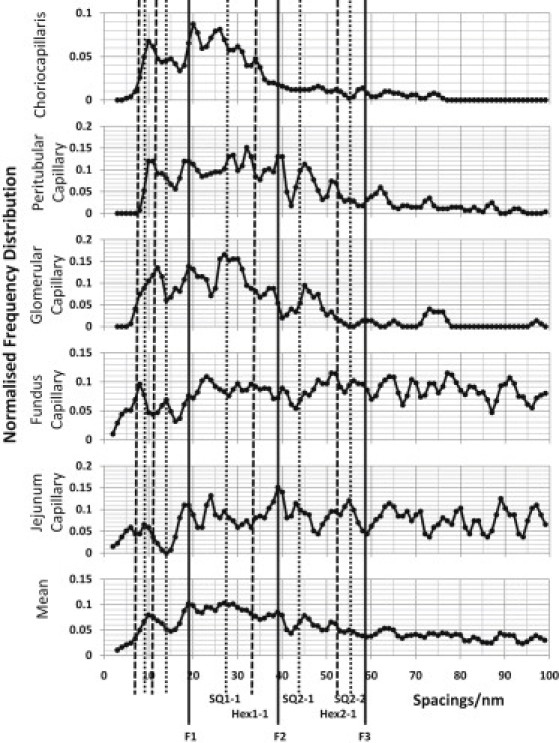
The glycocalyx or endocapillary layer on the luminal surface of microvessels has a major role in the exclusion of macromolecules from the underlying endothelial cells. Current structural evidence in the capillaries of frog mesentery indicates a regularity in the structure of the glycocalyx, with a center-to-center fiber spacing of 20 nm and a fiber width of 12 nm, which might explain the observed macromolecular filtering properties. In this study, we used electron micrographs of tissues prepared using perfusion fixation and tannic acid treatment. The digitized images were analyzed using autocorrelation to find common spacings and to establish whether similar structures, hence mechanisms, are present in the microvessel glycocalyces of a variety of mammalian tissues. Continuous glycocalyx layers in mammalian microvessels of choroid, renal tubules, glomerulus, and psoas muscle all showed similar lateral spacings at ∼19.5 nm (possibly in a quasitetragonal lattice) and longer spacings above 100 nm. Individual glycocalyx tufts above fenestrations in the first three of these tissues and also in stomach fundus and jejunum showed evidence for similar short-range structural regularity, but with more disorder. The fiber diameter was estimated as 18.8 (± 0.2) nm, but we believe this is an overestimate because of the staining method used. The implications of these findings are discussed.


Figures

Figure 1
Figure 1
Three TEM rat tissue examples of glycocalyx, from the jejunum capillary (A), the glomerular capillary (B), and the peritubular capillary (C), stained using the Rostgaard perfusion technique (17), with a previously proposed model from Squire et al. (12) (printed with permission); scale bar, 500 nm. (D) Model from the same view as for AC. (E) Same model as in D from the planar view. The spacings shown in the model are from the predominant peaks from frog mesentery. The mean spacing between the fibers was found to be 20 nm, but regularity was limited to one or two orders in most cases, presumably by a fluid model (nearest-neighbor) system. The 100-nm spacing was proposed to be from glycocalyx tufts linked to an underlying cytoskeletal array of filaments such as actin.
Figure 2
Figure 2
Results from peak-fitting autocorrelations of the projections (every 3°) of a square lattice. (A and B) To mimic our protocol, square and hexagonal (not shown) lattices of 20-pixel b spacing were drawn with different point diameters (9-pixel point diameter shown in A). (B) These lattices were rotated (θ) every 3°, and projections, P, were taken through a central rectangular slice 80 pixels thick, to represent section thickness. (C) The autocorrelations were fitted for peaks (as described in Methods), and a normalized FD was plotted (solid line). FD was also plotted for the FWHM of the peaks (dotted line). (D) The mean of the FWHM FD (solid points) and the maximum diameters (open points) were plotted against their measured diameters. The means are proportional (dotted line) to the actual fiber diameter, and our physiological measurements (horizontal dashed lines) are plotted with an unknown actual diameter for analytical interpretation.
Figure 3
Figure 3
Analysis method demonstrated on a peritubular capillary (A), a psoas muscle capillary (B), and a fundus capillary (C) from the boxed areas (rectangular outline) in the micrographs (insets). The AC was then obtained as described in the Supporting Material. An intensity profile was taken parallel to the membrane. A constant background was subtracted relative to the lowest value in the profile. To obtain the peaks from the (symmetric) AC intensity profile, a residuals method (negative spacing values) and a second-differential method (positive values) were used in Peakfit 4 (Jandel) to determine Gaussian peaks. An example of a false positive (FP) is shown in C. The resulting fit is also shown (dashed lines). An example of a FWHM measurement is given by the arrow (F) in A.
Figure 4
Figure 4
FD plots of the observed glycocalyx fiber spacings up to 100 nm measured from glycocalyx not over fenestrations. The FD is normalized to the number of fits. The vertical lines indicate expected positions for peaks from a tetragonal lattice (SQ) of observed side (b) 19.5 nm and a hexagonal lattice (Hex) of side b = 19.5/cos30 nm. The lines designated F1–F3 are fundamental lines associated with interplanar spacings in both lattices.
Figure 5
Figure 5
Same as for Fig. 4, but for FD plots of the interplanar glycocalyx fiber spacings up to 100 nm for capillaries in different tissues measured from glycocalyx over fenestrations.
Figure 6
Figure 6
Normalized FD plot of fiber spacings up to 300 nm in glycocalyces from all image areas, irrespective of tissue origin (solid line), with the number of image areas (m; right hand y axis) at each spacing (dotted line).
Figure 7
Figure 7
(A) Diagram of the conclusions from this study about the arrangement of the glycocalyx in a view looking toward the endothelial membrane from the lumen and showing the available space (AS) for water and for a macromolecule. (B) The partition coefficient between open solution and solution within the matrix for a tetragonal lattice with interfiber spacing b = 19.5 nm (squares) and for a hexagonal lattice with b = 22.5 nm (triangles), for fiber diameters of 5, 7, and 9.5 nm.

References

    1. Starling E.H. On the absorbtion of fluid from the connective tissue spaces. J. Physiol. 1896;19:312–326. - PMC - PubMed
    1. Luft J.H. Fine structure of capillaries: the endocapillary layer. Anat. Record. 1965;151:380.
    1. Levick J.R., Michel C.C. Microvascular fluid exchange and the revised Starling principle. Cardiovasc. Res. 2010;87:198–210. - PubMed
    1. Vink H., Duling B.R. Identification of distinct luminal domains for macromolecules, erythrocytes, and leukocytes within mammalian capillaries. Circ. Res. 1996;79:581–589. - PubMed
    1. Clementi F., Palade G.E. Intestinal capillaries. I. Permeability to peroxidase and ferritin. J. Cell Biol. 1969;41:33–58. - PMC - PubMed

Publication types

LinkOut - more resources