

Global expression profiling of peripheral Qa-1-restricted CD8αα+TCRαβ+ regulatory T cells reveals innate-like features: implications for immune-regulatory repertoire
- PMID: 21889557
- PMCID: PMC3261310
- DOI: 10.1016/j.humimm.2011.07.306
Global expression profiling of peripheral Qa-1-restricted CD8αα+TCRαβ+ regulatory T cells reveals innate-like features: implications for immune-regulatory repertoire
Abstract
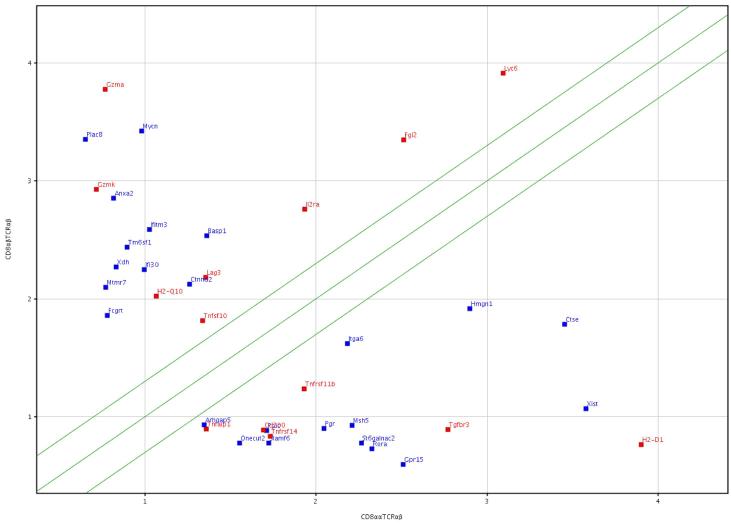
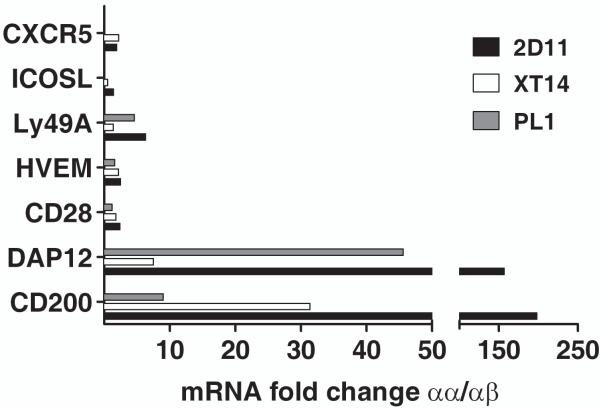
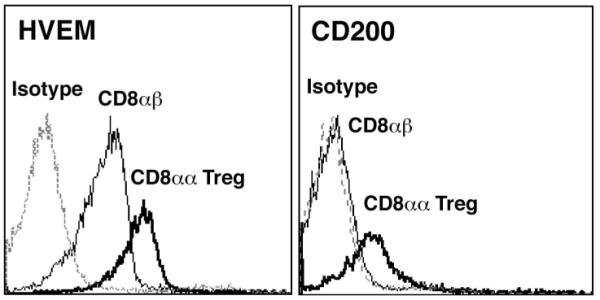
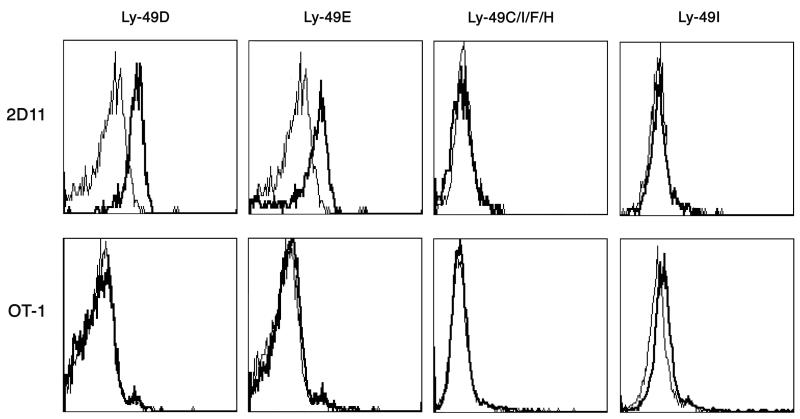
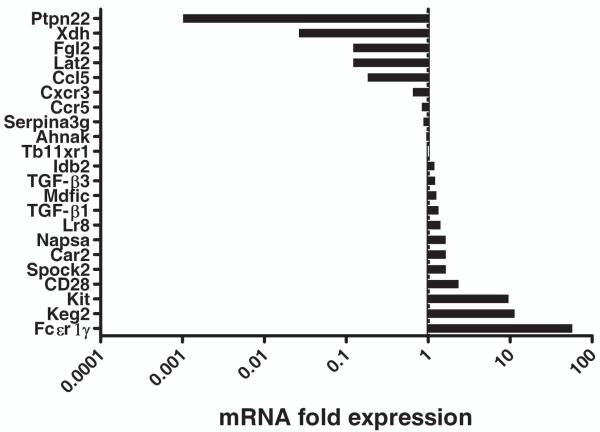
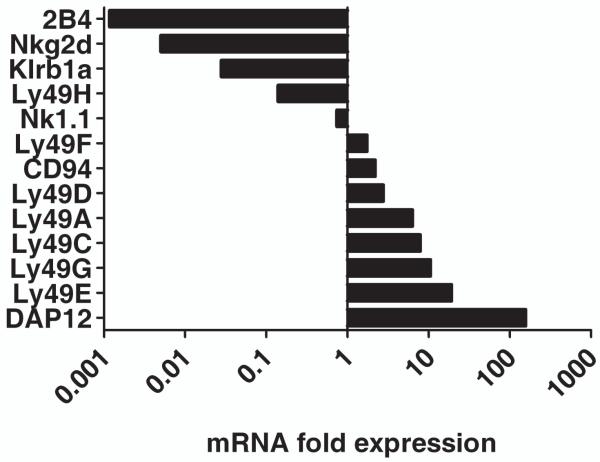
Among peripheral regulatory T cells, CD8(+) T cells also play an important role in the maintenance of immune homeostasis. A subset of CD8(+) Treg that express αβ T cell receptor (TCR) and CD8αα homodimers can recognize TCR-derived peptides in the context of the class Ib MHC molecule Qa-1. To gain a better understanding of the nature and phenotype of CD8αα(+)TCRαβ+ Treg, a global gene expression profiling using microarray, real-time quantitative polymerase chain reaction, and flow-cytometric analysis was performed using functional Treg clones and lines. The study findings show that CD8(+) Treg shared gene profile expressed by innate-like lymphocytes, including murine intraepithelial lymphocytes and thymic CD8αα(+)TCRαβ+ T-cell populations. In addition, this subset displays differential expression of several key regulatory molecules, including CD200. CD8αα(+) Treg expressed higher levels of a number of natural killer cell-related receptors and molecules belonging to the TNF superfamily. Collectively, peripheral class Ib-reactive CD8αα(+)TCRαβ+ T cells represent a unique regulatory population different from class Ia major histocompatibility complex-restricted conventional T cells. These studies have important implications for the regulatory mechanisms mediated by the CD8(+) Treg population in general.
Copyright © 2012 American Society for Histocompatibility and Immunogenetics. Published by Elsevier Inc. All rights reserved.
Figures
Similar articles
-
Regulation of immunity by a novel population of Qa-1-restricted CD8alphaalpha+TCRalphabeta+ T cells.J Immunol. 2006 Dec 1;177(11):7645-55. doi: 10.4049/jimmunol.177.11.7645. J Immunol. 2006. PMID: 17114434
-
Anti-TCR antibody treatment activates a novel population of nonintestinal CD8 alpha alpha+ TCR alpha beta+ regulatory T cells and prevents experimental autoimmune encephalomyelitis.J Immunol. 2007 May 15;178(10):6043-50. doi: 10.4049/jimmunol.178.10.6043. J Immunol. 2007. PMID: 17475828
-
Dendritic cells use endocytic pathway for cross-priming class Ib MHC-restricted CD8alphaalpha+TCRalphabeta+ T cells with regulatory properties.J Immunol. 2009 Jun 1;182(11):6959-68. doi: 10.4049/jimmunol.0900316. J Immunol. 2009. PMID: 19454693
-
CD8αα TCRαβ Intraepithelial Lymphocytes in the Mouse Gut.Dig Dis Sci. 2016 Jun;61(6):1451-60. doi: 10.1007/s10620-015-4016-y. Epub 2016 Jan 14. Dig Dis Sci. 2016. PMID: 26769056 Review.
-
The specific regulation of immune responses by CD8+ T cells restricted by the MHC class Ib molecule, Qa-1.Annu Rev Immunol. 2000;18:185-216. doi: 10.1146/annurev.immunol.18.1.185. Annu Rev Immunol. 2000. PMID: 10837057 Review.
Cited by
-
Class Ib MHC-Mediated Immune Interactions Play a Critical Role in Maintaining Mucosal Homeostasis in the Mammalian Large Intestine.Immunohorizons. 2021 Dec 15;5(12):953-971. doi: 10.4049/immunohorizons.2100090. Immunohorizons. 2021. PMID: 34911745 Free PMC article.
-
Treg in inborn errors of immunity: gaps, knowns and future perspectives.Front Immunol. 2024 Jan 8;14:1278759. doi: 10.3389/fimmu.2023.1278759. eCollection 2023. Front Immunol. 2024. PMID: 38259469 Free PMC article. Review.
-
Soluble fibrinogen like protein 2 (sFGL2), the novel effector molecule for immunoregulation.Oncotarget. 2017 Jan 10;8(2):3711-3723. doi: 10.18632/oncotarget.12533. Oncotarget. 2017. PMID: 27732962 Free PMC article. Review.
-
CD8αα+T cells exert a pro-inflammatory role in patients with psoriasis.Skin Health Dis. 2021 Nov 16;1(4):e64. doi: 10.1002/ski2.64. eCollection 2021 Dec. Skin Health Dis. 2021. PMID: 35663772 Free PMC article.
-
In situ differentiation of CD8αα Τ cells from CD4 T cells in peripheral lymphoid tissues.Sci Rep. 2012;2:642. doi: 10.1038/srep00642. Epub 2012 Sep 7. Sci Rep. 2012. PMID: 22962636 Free PMC article.
References
-
- Powrie F, Mauze S, Coffman RL. CD4+ T-cells in the regulation of inflammatory responses in the intestine. Res Immunol. 1997;148:576–81. [In Process Citation] - PubMed
-
- Sakaguchi S. Regulatory T cells: key controllers of immunologic self-tolerance. Cell. 2000;101:455–8. - PubMed
-
- Filaci G, Fenoglio D, Indiveri F. CD8(+) T regulatory/suppressor cells and their relationships with autoreactivity and autoimmunity. Autoimmunity. 2011;44:51–7. - PubMed
-
- Smith TR, Kumar V. Revival of CD8(+) Treg-mediated suppression. Trends Immunol. 2008 - PubMed
-
- Braud VM, Allan DS, McMichael AJ. Functions of nonclassical MHC and non-MHC-encoded class I molecules. Curr Opin Immunol. 1999;11:100–8. - PubMed
Publication types
MeSH terms
Substances
Grants and funding
LinkOut - more resources
Full Text Sources
Molecular Biology Databases
Research Materials
