. 2012 May;81(5):891-6.
doi: 10.1016/j.ejrad.2011.07.016. Epub 2011 Sep 1.

Permeability to macromolecular contrast media quantified by dynamic MRI correlates with tumor tissue assays of vascular endothelial growth factor (VEGF)

Affiliations

Permeability to macromolecular contrast media quantified by dynamic MRI correlates with tumor tissue assays of vascular endothelial growth factor (VEGF)

Clemens C Cyran et al. Eur J Radiol. 2012 May.

Abstract

Purpose: To correlate dynamic MRI assays of macromolecular endothelial permeability with microscopic area-density measurements of vascular endothelial growth factor (VEGF) in tumors.

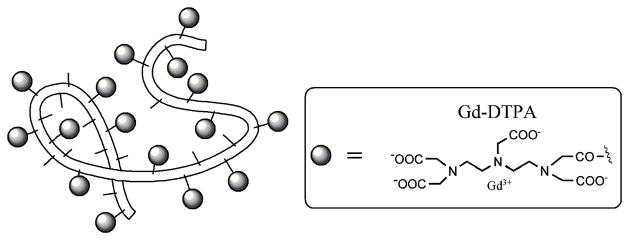
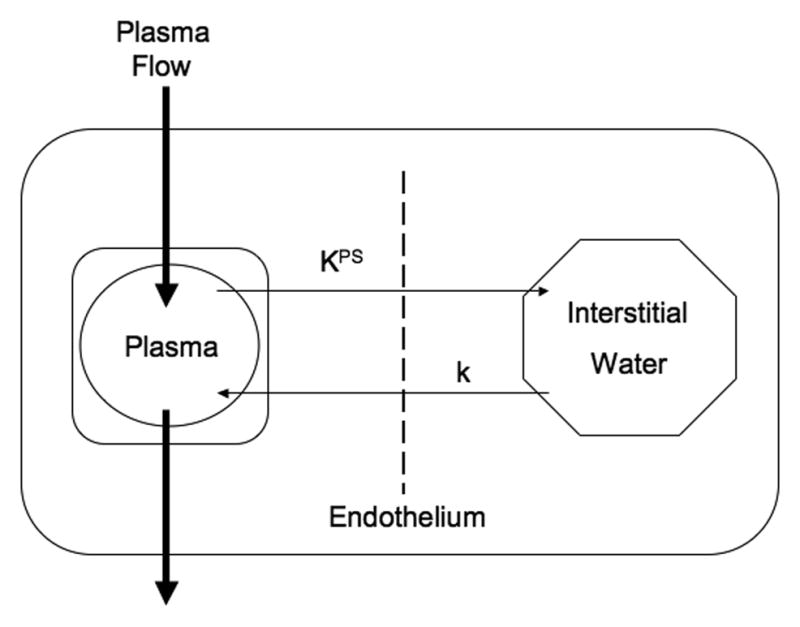
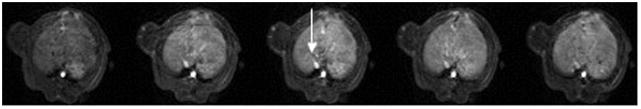
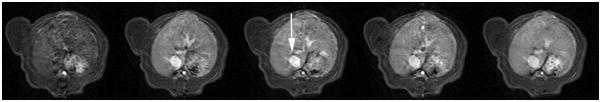
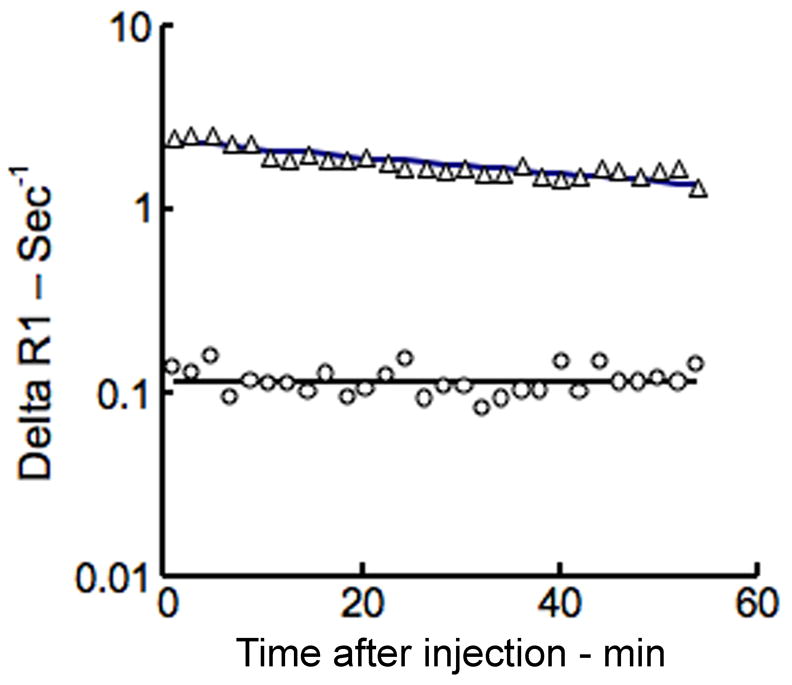
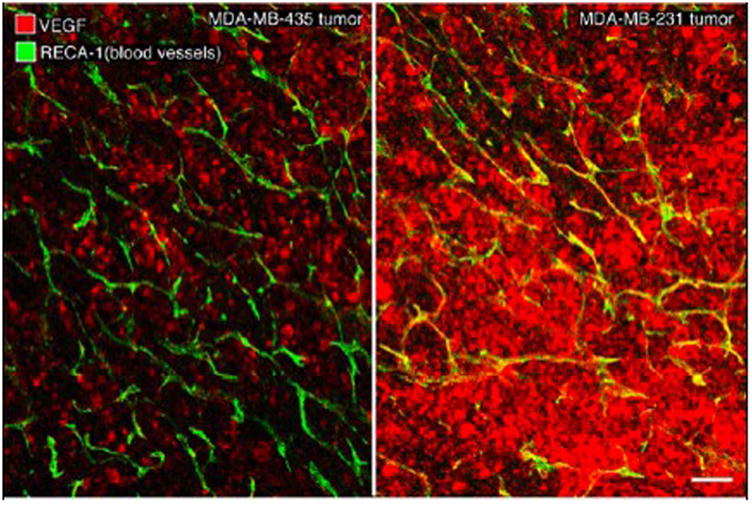
Methods and material: This study compared tumor xenografts from two different human cancer cell lines, MDA-MB-231 tumors (n=5), and MDA-MB-435 (n=8), reported to express respectively higher and lower levels of VEGF. Dynamic MRI was enhanced by a prototype macromolecular contrast medium (MMCM), albumin-(Gd-DTPA)35. Quantitative estimates of tumor microvascular permeability (K(PS); μl/min × 100 cm(3)), obtained using a two-compartment kinetic model, were correlated with immunohistochemical measurements of VEGF in each tumor.

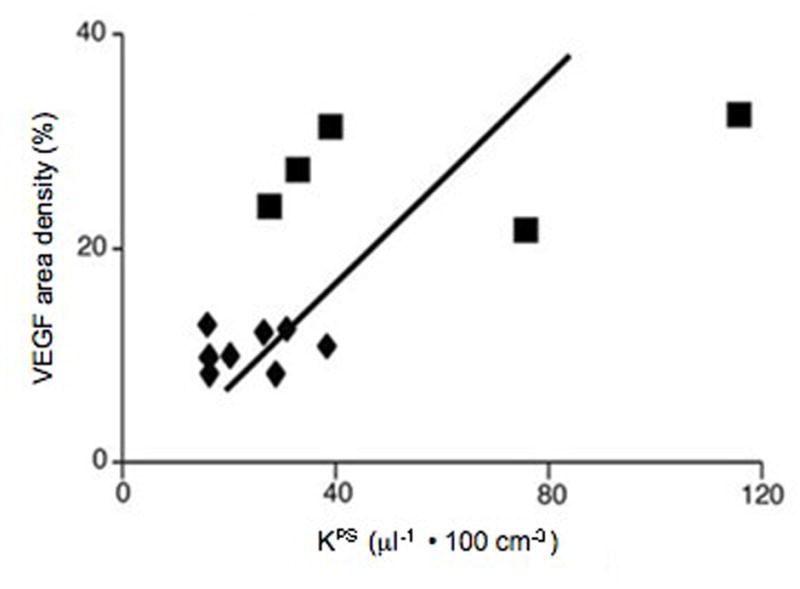
Results: Mean K(PS) was 2.4 times greater in MDA-MB-231 tumors (K(PS)=58 ± 30.9 μl/min × 100 cm(3)) than in MDA-MB-435 tumors (K(PS)=24 ± 8.4 μl/min × 100 cm(3)) (p<0.05). Correspondingly, the area-density of VEGF in MDA-MB-231 tumors was 2.6 times greater (27.3 ± 2.2%, p<0.05) than in MDA-MB-435 cancers (10.5 ± 0.5%, p<0.05). Considering all tumors without regard to cell type, a significant positive correlation (r=0.67, p<0.05) was observed between MRI-estimated endothelial permeability and VEGF immunoreactivity.

Conclusion: Correlation of MRI assays of endothelial permeability to a MMCM and VEGF immunoreactivity of tumors support the hypothesis that VEGF is a major contributor to increased macromolecular permeability in cancers. When applied clinically, the MMCM-enhanced MRI approach could help to optimize the appropriate application of VEGF-inhibiting therapy on an individual patient basis.


Figures

Figure 1
Figure 1
Schematic structure of albumin-(Gd-DTPA)35. The belt-like random coil represents the human albumin core structure with amino-containing side chains of the lysine residues (small sticks) to which Gd-DTPA (grey ovals) are covalently attached. The actual molecular weight of this macromolecule is 92 kDa, while its effective molecular weight is approximately 180 kDa with a measured hydrodynamic diameter of approximately 6 nanometers.
Figure 2
Figure 2
Two-compartment kinetic model used to describe the kinetics of contrast media transport from the plasma space into the interstitial fluid. The endothelial transfer coefficient KPS [μL/(min · 100 cm3)] denotes the clearance of contrast medium from plasma to interstitial water. Potential reflux of contrast media molecules from interstitial fluid back to plasma, denoted as the rate constant k (min−1), was not resolvable in the short, one hour time course of these experiments and was therefore set to zero. The box around the plasma compartment denotes a forcing function representing the mono-exponential disappearance of MMCM from the blood. The combined kinetics of both compartments, when considered together, reflect the dynamic response of the entire tissue/tumor to contrast medium enhancement.
Figure 3
Figure 3
Representative T1-weighted spoiled gradient refocused (SPGR) images, precontrast and at 5 min, 15 min, 30 min and 55 min post injection of albumin-(Gd-DTPA)35 which were applied for the calculation of the endothelial transfer coefficient (KPS). Note the moderate tumor enhancement, most prominent in the rim in the MDA-MB-435 tumor (a) and in the MDA-MB-231 (b) tumor. The blood enhancement seen clearly in the inferior vena cava (white arrow) and nearby hepatic vein, persisted over the 55-minute course of data acquisition. The highly vascularized liver enhances substantially.
Figure 3
Figure 3
Representative T1-weighted spoiled gradient refocused (SPGR) images, precontrast and at 5 min, 15 min, 30 min and 55 min post injection of albumin-(Gd-DTPA)35 which were applied for the calculation of the endothelial transfer coefficient (KPS). Note the moderate tumor enhancement, most prominent in the rim in the MDA-MB-435 tumor (a) and in the MDA-MB-231 (b) tumor. The blood enhancement seen clearly in the inferior vena cava (white arrow) and nearby hepatic vein, persisted over the 55-minute course of data acquisition. The highly vascularized liver enhances substantially.
Figure 4
Figure 4
Representative fit (solid lines) of model to delta R1 data from blood (△) and tumor (○) using this MMCM-enhanced protocol. Notice the trend toward convergence of the blood and tumor plots on this semi-logarithmic graph indicative of a gradual leak of the MMCM from the intravascular space into the interstitial compartment of this tumor; the more the convergence, the larger is the leak. No convergence, i.e., parallel, gradually decreasing behavior on this semi-logarithmic graph implies the lack of a leak.
Figure 5
Figure 5
Confocal microscopic images of representative MDA-MB-435 (left) and MDA-MB-231 (right) tumors, specifically-stained for VEGF (red) with blood vessels shown as green/yellow. Note the relatively lower level of red-staining VEGF in MDA-MB-435 tumor and the much higher expression of VEGF in MDA-MB-231 tumor. White scale bar: 120 μm.
Figure 6
Figure 6
Correlation of VEGF area-density measurements with KPS determinations based upon 13 tumors. MDA-MB-435 tumors are depicted by triangles and MDA-MB-231 tumors by squares. Solid line denotes the best fit linear correlation line. The correlation (r=0.67) is statistically significant (p<0.05), with some overlap in the KPS determinations from the two tumor groups.

References

    1. Folkman J. What is the evidence that tumors are angiogenesis dependent? J Natl Cancer Inst. 1990;82(1):4–6. - PubMed
    1. Nagy JA, Benjamin L, Zeng H, Dvorak AM, Dvorak HF. Vascular permeability, vascular hyperpermeability and angiogenesis. Angiogenesis. 2008;11(2):109–19. - PMC - PubMed
    1. Ferrara N, Gerber HP, LeCouter J. The biology of VEGF and its receptors. Nat Med. 2003;9(6):669–76. - PubMed
    1. Jeong AK, Choi SI, Kim DH, et al. Evaluation by contrast-enhanced MR imaging of the lateral border zone in reperfused myocardial infarction in a cat model. Korean J Radiol. 2001;2(1):21–7. - PMC - PubMed
    1. Cyran CC, Sennino B, Chaopathomkul B, et al. Magnetic resonance imaging for monitoring the effects of thalidomide on experimental human breast cancers. Eur Radiol. 2009;19(1):121–31. - PMC - PubMed

MeSH terms