Comparative Study
. 2011 Nov;32(11):1724-33.
doi: 10.1093/carcin/bgr196. Epub 2011 Sep 1.

Activation of the mTOR pathway by low levels of xenoestrogens in breast epithelial cells from high-risk women

Affiliations
Comparative Study

Activation of the mTOR pathway by low levels of xenoestrogens in breast epithelial cells from high-risk women

William H Goodson 3rd et al. Carcinogenesis. 2011 Nov.

Abstract

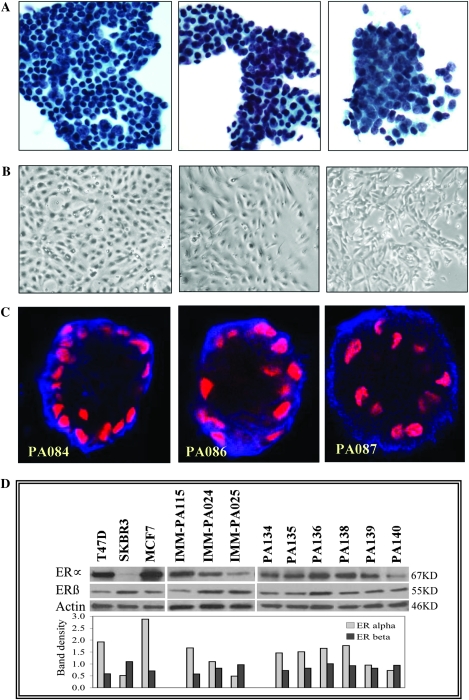
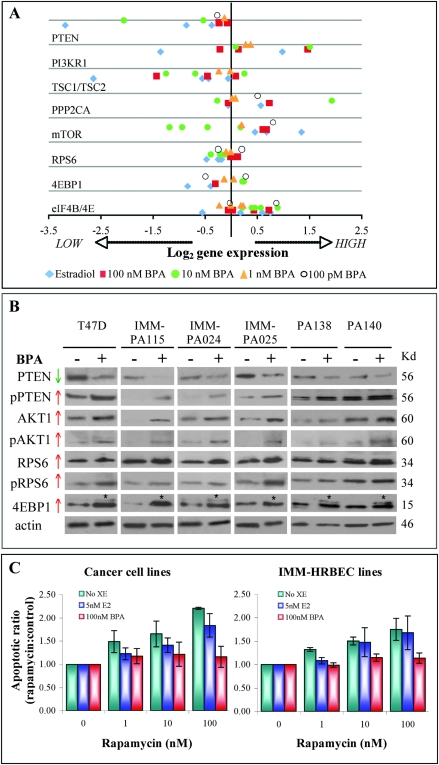
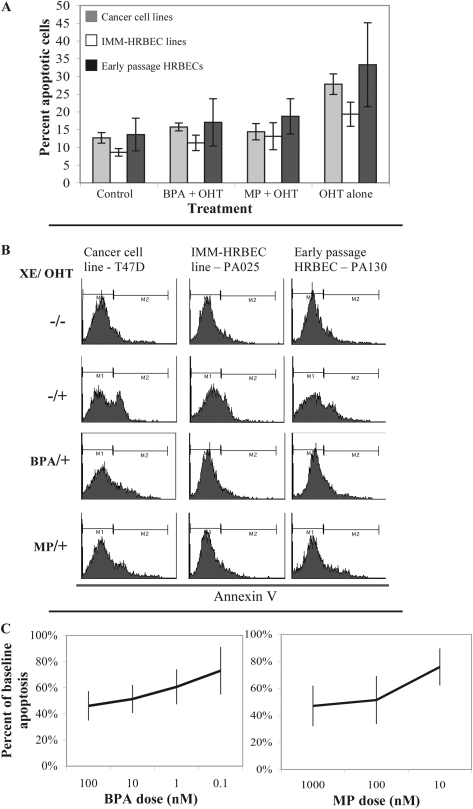
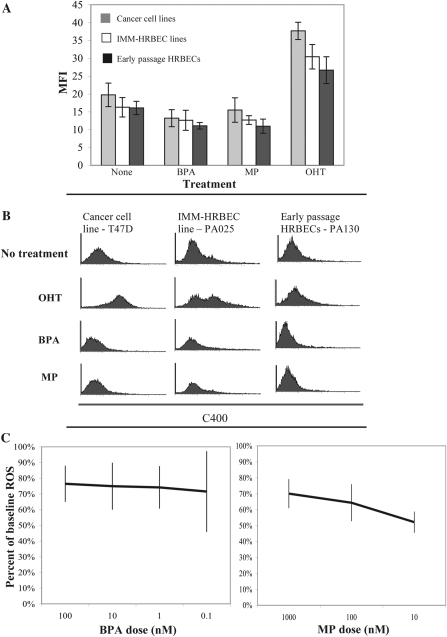
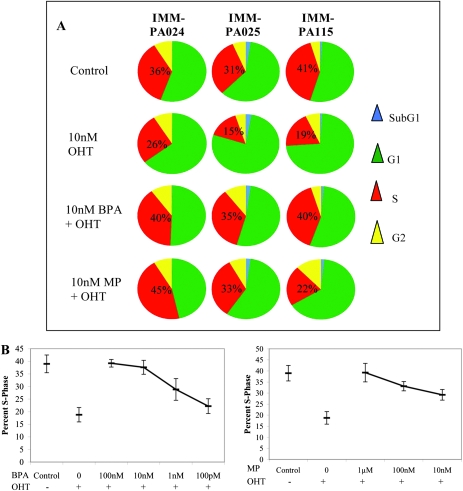
Breast cancer is an estrogen-driven disease. Consequently, hormone replacement therapy correlates with disease incidence. However, increasing male breast cancer rates over the past three decades implicate additional sources of estrogenic exposure including wide spread estrogen-mimicking chemicals or xenoestrogens (XEs), such as bisphenol-A (BPA). By exposing renewable, human, high-risk donor breast epithelial cells (HRBECs) to BPA at concentrations that are detectable in human blood, placenta and milk, we previously identified gene expression profile changes associated with activation of mammalian target of rapamycin (mTOR) pathway genesets likely to trigger prosurvival changes in human breast cells. We now provide functional validation of mTOR activation using pairwise comparisons of 16 independent HRBEC samples with and without BPA exposure. We demonstrate induction of key genes and proteins in the PI3K-mTOR pathway--AKT1, RPS6 and 4EBP1 and a concurrent reduction in the tumor suppressor, phosphatase and tensin homolog gene protein. Altered regulation of mTOR pathway proteins in BPA-treated HRBECs led to marked resistance to rapamycin, the defining mTOR inhibitor. Moreover, HRBECs pretreated with BPA, or the XE, methylparaben (MP), surmounted antiestrogenic effects of tamoxifen showing dose-dependent apoptosis evasion and induction of cell cycling. Overall, XEs, when tested in benign breast cells from multiple human subjects, consistently initiated specific functional changes of the kind that are attributed to malignant onset in breast tissue. Our observations demonstrate the feasibility of studying renewable human samples as surrogates and reinforce the concern that BPA and MP, at low concentrations detected in humans, can have adverse health consequences.


Figures

Fig. 1.
Fig. 1.
RPFNA-derived HRBEC cultures display characteristic non-malignant epithelial phenotypes. (A) Micrographs of cell clusters present in independent representative RPFNA samples. (B) Early passage pure epithelial cultures derived from clusters similar to those shown in A (Brightfield, × 4 objective). (C) Three-dimensional growth pattern of colonies derived from early passage HRBEC cultures in Matrigel. Basal immunolocalization of alpha-6 integrin (blue) and acinar orientation of nuclei (red) in 10 day-old colonies. (D) Relative ERα and ERβ protein levels in breast cancer cell lines (T47D, SKBR3 and MCF7), spontaneously immortalized HRBEC lines (IMM-PA024, IMM-PA025 and IMM-PA115) and early passage HRBECs (PA134, PA135, PA136, PA138, PA139 and PA140) quantitated by western blotting. Numerical values of each protein band representing ERα or ERβ obtained by densitometric scanning were normalized to actin levels in the lysate and plotted. Note low to moderate ERα levels in HRBECs relative to T47D and MCF7, but higher than the SKBR3 cell line, HRBECs display a distinctive ER profile unlike conventional ER-positive or ER-negative breast cancer cell lines.
Fig. 2.
Fig. 2.
BPA exposure modulates expression of mTOR pathway components and induces functional changes in breast epithelial cells. (A) QPCR measurements of relative transcript levels of mTOR pathway genes in early passage HRBEC cultures (PA024, PA025, PA072, PA075, PA081 and PA112) normalized to housekeeping genes. Data represent exposure to a low dose range of BPA or to a luteal serum estradiol (E2) level. Plotted values represent fold change for each gene in treated samples, relative to the corresponding untreated control sample. Each data point is an average of triplicate QPCRs. (B) BPA-induced alterations in mTOR pathway proteins in early passage (PA138 and PA140), immortalized HRBECs (IMM-PA024, IMM-PA025 and IMM-115) and breast cancer cells (T47D). Pretreatment with BPA reduces steady-state PTEN protein levels and promotes functional inactivation by increased phosphorylation (indicated by ‘P’) at sites S380/T382/T383 compared with untreated controls. Increased expression of total and phosphorylated AKT1 (at S473), RPS6 (at S235/236) and 4EBP1 (at multiple sites) is detectable in both non-malignant and malignant breast cells. Asterisks indicate shift in the molecular weight of phosphorylated 4EBP1. (C) Effects of BPA pretreatment in the induction of resistance to the mTOR inhibitor, rapamycin. Data plotted to represent Annexin V-positive apoptotic populations within breast cancer cell lines (T47D, SKBR3—left panel) and HRBEC lines (IMM-PA024, IMM-PA025, IMM-PA115—right panel). Each bar represents the mean and standard deviation of triplicate values. Increased apoptotic ratios were observed with increasing doses of rapamycin in all cultures without BPA pretreatment. Values demonstrating the effect of BPA in reducing rapamycin-induced apoptosis were statistically significant in all cell lines (P > 0.001).
Fig. 3.
Fig. 3.
XE exposure promotes apoptosis evasion in HRBEC cultures. (A) Potential for XE-induced apoptosis evasion measured as percent reduction in Annexin V-positive cells by FACS analysis. Breast cancer cell lines (T47D and SKBR3), HRBEC cell lines (IMM-PA024, IMM-PA025 and IMM-PA115) and early passage HRBEC (PA094, PA099, PA103, PA106, PA107 and PA130) exposed to BPA or MP were treated with OHT for 24 h prior to Annexin V staining and compared with untreated controls. All experiments were performed in triplicate. Plots illustrate average values and the standard deviation for each culture group under conditions of no treatment, XE exposure followed by OHT or OHT treatment alone. Values demonstrating the effect of XEs in reducing OHT-induced apoptosis are statistically significant in all cases (P < 0.002). (B) FACS profiles of representative samples. M1 fraction—autofluorescence; M2—Annexin V-positive cells (which increase with OHT treatment). (C) Dose–response measurements (shown as decreasing XE concentrations from left to right) in early passage HRBECs. In all cases, the protection from OHT-induced apoptosis (apoptotic evasion) was calculated as a fraction of the apoptotic response in the absence of XEs (set to 1). Each data point represents an average of eight independent HRBEC samples (shown individually in supplementary Figure S1 is available at Carcinogenesis Online). Error bars display the variation between cases (triplicate values for each case). Note a striking dose–response effect for both XEs, despite variability between samples in the protection from OHT-induced apoptosis.
Fig. 4.
Fig. 4.
XE exposure alters oxidative stress levels in breast epithelial cells. (A) Comparative analysis of intracellular ROS levels measured and quantified by FACS analysis of C400-stained cancer cell lines (T47D and SKBR3), HRBEC lines (IMM-PA024, IMM-PA025 and IMM-PA115) and early passage HRBEC cultures (PA094, PA099, PA103, PA106, PA107 and PA130) exposed to BPA or MP. A post-XE 24 h treatment with tamoxifen (OHT) was used to induce ROS. All experiments were performed in triplicate. Averaged data representing the MFI of C400 are plotted, and standard deviations are shown. Values demonstrating the effect of XEs in reducing OHT-induced ROS are statistically significant in all cases (P < 0.0001). (B) FACS profiles of representative samples. The area under each curve reflects C400-positive cells. Note the right shift of the C400 peak in OHT-treated samples (indicating higher MFI) when compared with untreated control populations (top two panels) and the mild reduction of MFI in cells exposed to XEs (bottom two panels). (C) ROS levels measured as C400 MFI in early passage HRBECs exposed to various concentrations of BPA or MP. Results are expressed as percent reduction from baseline MFI of no XE controls. Each data point represents an average of six independent HRBEC samples (shown individually in supplementary Figure S2, available at Carcinogenesis Online). Error bars display the variation between cases.
Fig. 5.
Fig. 5.
XE exposure compromises tamoxifen-mediated cell cycle arrest in breast epithelial cells—(A) Cell cycle data derived from bromodeoxyuridine labeling of HRBEC lines (IMM-PA024, IMM-PA025 and IMM-PA115). Representative pie charts illustrate percent cells in different phases of the cell cycle (red—S-phase, yellow—G2, green—G1 and blue—sub G1). Note reversal of OHT-induced G1 arrest and subsequent S-phase decline in XE-pretreated cells. IMM-PA115 is relatively insensitive to the MP concentration shown compared with the other two HRBEC lines. (B) Graphical summary of S-phase reduction in OHT-treated cells and maintenance of S-phase by BPA (left panel) and MP (right panel) pretreatment in response to decreasing concentrations (from left to right). Plots represent an average of the combined bromodeoxyuridine-positive populations and standard deviations around the mean within independent HRBEC lines exposed to either BPA or MP (IMM-PA024, IMM-PA025 and IMM-PA115), shown individually in supplementary Figure S3 (available at Carcinogenesis Online).

References

    1. Vom Saal FS, et al. An extensive new literature concerning low-does effects of bisphenol-A shows the need for a new risk assessment. Environ. Health Perspec. 2005;113:926–933. - PMC - PubMed
    1. Darbre PD, et al. Paraben esters: review of recent studies of endocrine toxicity, absorption, esterase and human exposure, and discussion of potential human risks. J. Appl. Toxicol. 2008;28:561–578. - PubMed
    1. Calafat AM, et al. Exposure of the U.S. population to bisphenol A and 4-tertiary-octylphenol: 2003-2004. Environ. Health Perspect. 2008;116:39–44. - PMC - PubMed
    1. Statistics Canada. Bisphenol A concentrations in the Canadian population, 2007 to 2009. http://www.statcan.gc.ca/pub/82-003-x/2010003/article/11324/tbl/tbl1-eng... (17 April 2011, date last accessed)
    1. Padmanabhan V, et al. Maternal bisphenol-A levels at delivery: a looming problem? J. Perinatol. 2008;28:258–263. - PMC - PubMed

Publication types

MeSH terms