. 2011 Nov 11;286(45):39269-81.
doi: 10.1074/jbc.M111.277756. Epub 2011 Sep 2.

AKAP220 protein organizes signaling elements that impact cell migration

Affiliations

AKAP220 protein organizes signaling elements that impact cell migration

Jeremy S Logue et al. J Biol Chem. .

Abstract

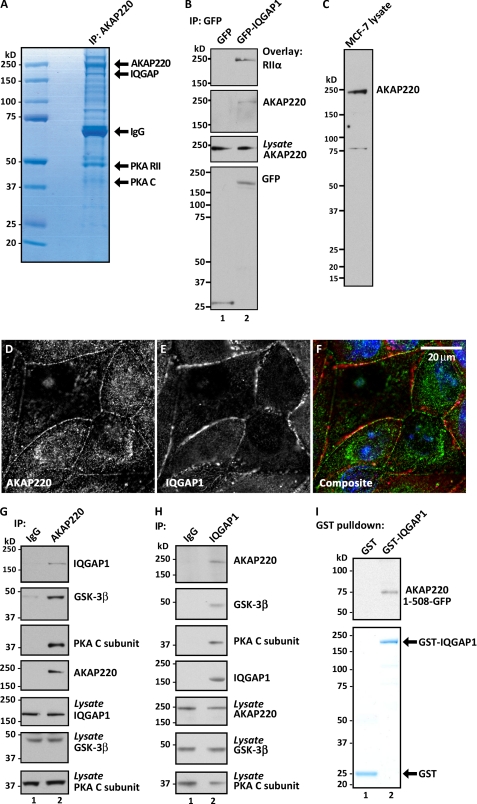
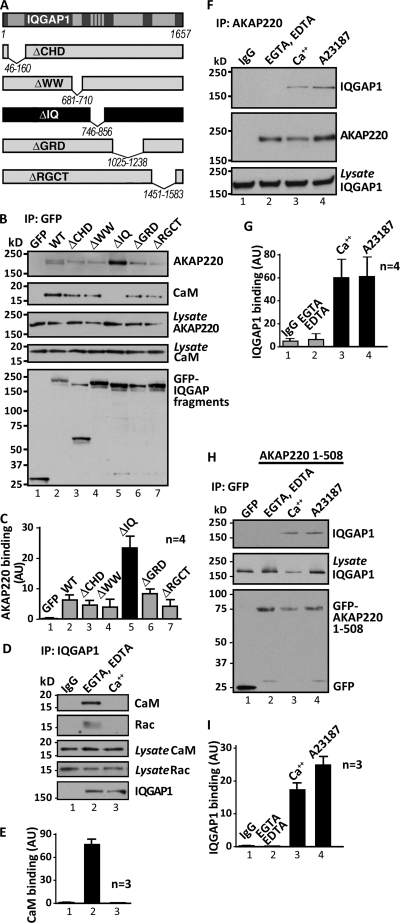
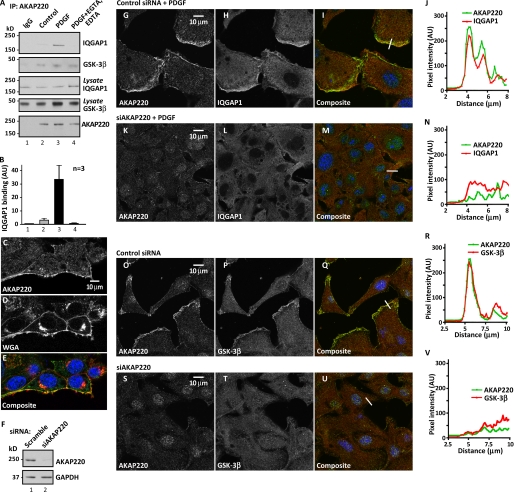
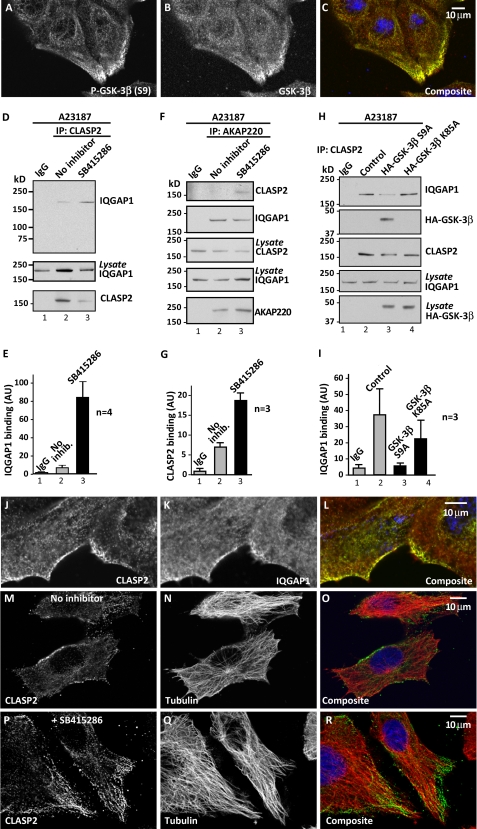
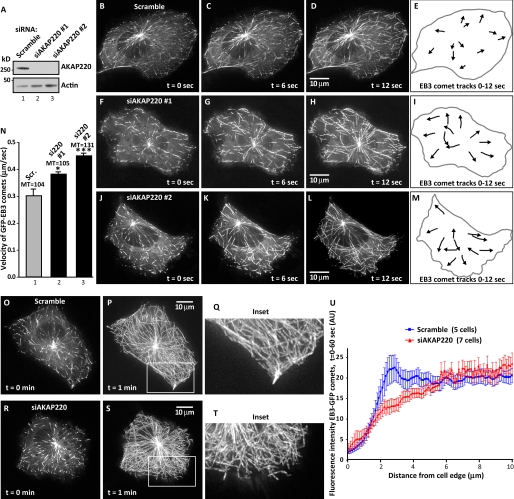
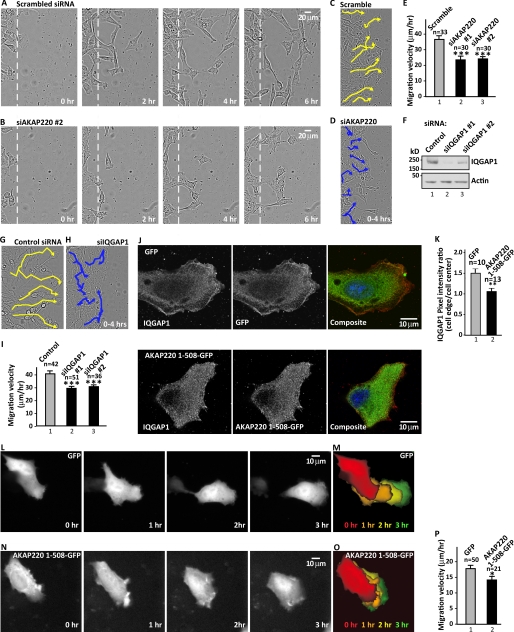
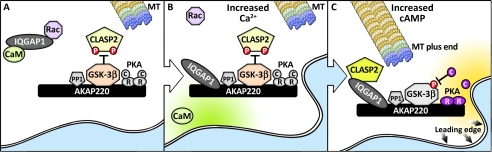
Cell movement requires the coordinated reception, integration, and processing of intracellular signals. We have discovered that the protein kinase A anchoring protein AKAP220 interacts with the cytoskeletal scaffolding protein IQGAP1 to influence cell motility. AKAP220/IQGAP1 networks receive and integrate calcium and cAMP second messenger signals and position signaling enzymes near their intended substrates at leading edges of migrating cells. IQGAP1 supports calcium/calmodulin-dependent association of factors that modulate microtubule dynamics. AKAP220 suppresses GSK-3β and positions this kinase to allow recruitment of the plus-end microtubule tracking protein CLASP2. Gene silencing of AKAP220 alters the rate of microtubule polymerization and the lateral tracking of growing microtubules and retards cell migration in metastatic human cancer cells. This reveals an unappreciated role for this anchored kinase/microtubule effector protein network in the propagation of cell motility.


Figures

FIGURE 1.
FIGURE 1.
AKAP220 assembles a complex that includes IQGAP1, GSK-3β, and PKA. A, FLAG-tagged AKAP220 immune complexes were isolated from HEK-293 cells and separated by SDS-PAGE. AKAP220 and selected binding partners were detected by Coomassie Blue stain. Molecular mass markers are indicated. B, immunoprecipitates of GFP-tagged IQGAP1 from COS cells were examined for co-purifying AKAPs by overlay of blots with digoxigenin-labeled type II PKA regulatory subunits (RIIα). C, immunoblot analysis of MCF-7 cell lysates using anti-AKAP220 antibody. D--F, immunofluorescent confocal analysis of endogenous AKAP220 (D and F, green) and IQGAP1 (E and F, red) in confluent MCF-7 cultures. Nuclei were identified with DRAQ5 dye (F, blue). Scale bar, 20 μm. G, co-IP of endogenous AKAP220, IQGAP1, GSK-3β, and the catalytic subunit of PKA (C subunit) from MCF-7 cells. H, reciprocal co-IP of endogenous IQGAP, AKAP220, GSK-3β, and PKAC subunit. I, recombinant GST-IQGAP1 was used to pull down in vitro-translated GFP-tagged AKAP220 (1–508 amino acids). Co-purification of AKAP220 was determined by immunoblotting for the GFP tag (top). GST tagged proteins were detected by Coomassie Blue stain (bottom). See also supplemental Fig. S1.
FIGURE 2.
FIGURE 2.
Analyses of AKAP220 and IQGAP1 interaction. A, diagram depicting domains of IQGAP1 wild-type and deletion mutants. CHD, calponin homology domain; WW, poly-proline protein-protein domain; IQ, 4 IQ motifs domain; GRD, rasGAP-related domain; RGCT, RasGAP carboxy terminal domain. B, IP of GFP-tagged IQGAP1 wild-type and indicated mutants from COS cells. Co-purification of AKAP220 and CaM is shown in blots overlaid with digoxigenin-labeled type II PKA regulatory subunits (RIIα) (top) or immunoblotted for endogenous CaM (middle). C, densitometry analysis of data in B. The AKAP220 signal in the top panel was normalized to IQGAP1 fragment expression shown in bottom panel (n = 4), mean ± S.E. D, IP of endogenous IQGAP1 from MCF-7 cells in the presence of chelators (EGTA and EDTA, 1 mm each), CaCl2 (1 mm), or from cells pretreated with the ionophore A23187 (5 μm) for 20 min. Co-precipitating, endogenous CaM (top) and Rac are shown. E, densitometry analysis of data in D. CaM in the top panel is normalized to CaM in lysates (middle panel, n = 3, mean ± S.E.). F, IP of endogenous AKAP220 from MCF-7 cells in the presence of chelators (1 mm each), CaCl2 (1 mm), or from cells pretreated for 20 min with ionophore A23187 (5 μm). Immunoblots show co-purification of endogenous IQGAP1 (top). Shown are AKAP220 (middle) and levels of IQGAP in the lysates (bottom). G, densitometry analysis of data in F. IQGAP1 in the top panel is normalized to IQGAP1 in lysates (bottom panel, n = 4, mean ± S.E.). H, IP of the GFP-tagged AKAP220 1–508-amino acid fragment from COS cells in the presence of chelators (1 mm each), CaCl2 (1 mm), or from cells pretreated for 20 min with ionophore A23187 (5 μm). Immunoblots show co-purification of endogenous IQGAP1. I, densitometry analysis. IQGAP1 in the top panel is normalized to IQGAP1 in lysates (middle panel, n = 3, mean ± S.E.). See also supplemental Fig. S2.
FIGURE 3.
FIGURE 3.
AKAP220 organizes IQGAP1 and GSK-3β at the leading edge of motile cells in response to growth factors. A, formation of the AKAP220-IQGAP complex in response to growth factor stimulation (PDGF; 50 ng/ml for 20 min). AKAP220 immune complexes isolated from control (lane 2), PDGF-stimulated (lane 3), and PDGF+EGTA-treated (lane 4) cell lysates. Samples were probed for IQGAP1 (top), GSK-3β (top middle panel), and AKAP220 (bottom) by immunoblot. B, densitometry analysis. IQGAP1 in top panel (A) is normalized to IQGAP1 in lysates (middle panel, A) (n = 3), mean ± S.E. C–E, scratch-wounded and PDGF-stimulated cells were fixed and stained for fluorescence detection of AKAP220 (C) and Alexa Fluor 594-conjugated (D) wheat germ agglutinin (WGA) as a general membrane marker. E, nuclear staining with DRAQ5 is also shown in the composite image. F, gene silencing of AKAP220. Immunoblot detection of AKAP220 (top) and GAPDH (bottom) loading control. G–I and K–M, confocal immunofluorescence detection of AKAP220 (G) and IQGAP1 (H) in migrating HT1080 cells that had been scratch-wounded and PDGF-stimulated. Composite image (I) includes DRAQ5 staining as a nuclear marker (blue). K–M, gene silencing of AKAP220 prior to scratch wounding and PDGF stimulation altered the appearance of the AKAP220 and IQGAP1 immunofluorescent staining. J and N, measurement of pixel intensity (left to right) for AKAP220 (green) and IQGAP1 (red) along an arbitrary straight line (I and M) was plotted using NIH ImageJ software. O–Q and S–U, confocal immunofluorescence detection of AKAP220 (O) and GSK-3β (P) in scratch-wounded and PDGF-stimulated HT1080 cells. Composite image (Q) includes DRAQ5 staining as a nuclear marker. R and V, quantitative evaluation of overlap between the AKAP220 (green) and GSK-3β (red) signals at the indicated leading edge (white bar; Q and U) was plotted using NIH ImageJ software. S–U, the staining pattern for both proteins in cells treated with a siRNA against AKAP220 prior to scratch wounding and PDGF stimulation. All confocal images are taken from a region adjacent to the wound. AKAP220 siRNA-1 was used in knockdown experiments. See also supplemental Fig. S3. AU, arbitrary units.
FIGURE 4.
FIGURE 4.
CLASP2 interaction with IQGAP1. A–C, immunofluorescent confocal detection of phospho-Ser 9-GSK-3 (A), total GSK-3 (B), and composite images (C) in scratch-wounded and PDGF-stimulated (50 ng/ml) HT1080 cells. The image was taken from a region adjacent to the wound. D, endogenous CLASP2 was immunoprecipitated from cells pretreated with GSK-3 inhibitors (50 μm SB415286) for 1 h and subsequently treated with the ionophore A23187 (5 μm) for 20 min. Immunoblots show co-purification of endogenous IQGAP1. E, densitometry analysis. IQGAP1 in the top panel (C) is normalized to IQGAP1 in lysates (middle panel, C; n = 3), mean ± S.E. Analysis of lanes 2 and 3 using a two-tailed Student's t test revealed a p value = 0.022. F, endogenous AKAP220 complex was immunoprecipitated in the presence or absence of the GSK-3 inhibitor SB415286 (50 μm). Immunoprecipitates were probed for CLASP2 (top), IQGAP1 (second top panel), and AKAP220 (bottom). Levels of IQGAP1 and CLASP2 in the lysates are shown. G, densitometry analysis shows relative co-precipitation of CLASP2. Level of CLASP2 in the top panel of B normalized to CLASP2 in lysates (n = 3, mean ± S.E.). Analysis of lanes 2 and 3 using a two-tailed Student's t test revealed a p value = 0.007. H, endogenous CLASP2 was immunoprecipitated from cells transfected with GSK-3β mutants that are either constitutively active (S9A; lane 3) or inactive (K85A; lane 4). Immunoblots show co-purification of IQGAP1 (top) and GSK-3β (second top panel). Expression of HA-tagged GSK-3β is shown (bottom). I, densitometry analysis. IQGAP1 in the top panel (F) is normalized to IQGAP1 in lysates (middle bottom panel, F; n = 3, mean ± S.E.). J–L, immunofluorescent confocal detection of CLASP2 (J), IQGAP1 (K), and composite images (L) in scratch-wounded and PDGF-stimulated (50 ng/ml) HT1080 cells. Images are taken from a region of the culture dish adjacent to the wound. M–R, pharmacological inhibition of GSK-3 alters the distribution of CLASP2. Immunofluorescent confocal detection of CLASP2 (M), tubulin (N), and composite images (O) in HT1080 cells. Detection of CLASP2 (P), tubulin (Q), and composite images (R) HT1080 cells treated with SB415286 (50 μm). See also supplemental Fig. S4.
FIGURE 5.
FIGURE 5.
AKAP220 impacts microtubule dynamics. A, top, immunoblot showing siRNA knockdown of AKAP220 in HT1080 human fibrosarcoma cells. Actin (bottom) is used as loading control. B–D, EB3-GFP comet tracks recorded in scrambled siRNA-treated HT1080 cells that were scratch-wounded and treated with PDGF (50 ng/ml). Images of projections at 0 s (B) and spanning 0–6 s (C) and 0–12 s (D) are shown. E, representative EB3 comet tracks spanning 12 s traced over an outline of the cell. Comet tracks were prepared using the Manual Tracking plug-in for NIH ImageJ software. F–M, EB3-GFP comets were tracked as above in cells depleted of the anchoring protein with siAKAP220-1 or siAKAP220-2 as indicated. Images of projections (F–H) and (J–L) and representative comet tracks (I and M) are shown. N, quantitative analysis of EB3-GFP comet velocities in live siRNA-treated HT1080 cells (as in B–M) with S.E. and statistical significance (unpaired two-tailed Student's t test; *, p ≤ 0.05 and ***, p ≤ 0.001). The number of microtubules (MT) used in analyses is indicated above each column. O–T, time 0 and 1 min projections of EB3-GFP comet tracks near the periphery in cells treated with scramble (Scr.) siRNA (O–Q) and siAKAP220 (R–T). U, pixel intensities along a line from the cell edge to the interior were measured using the 1-min projections of EB3-GFP comets in scramble siRNA (5 cells, blue line) and siAKAP220-treated cells (7 cells, red line). Error bars, S.E. See also supplemental Movies S1–S3.
FIGURE 6.
FIGURE 6.
AKAP220 promotes cell migration. A and B, representative time course images of cell migration across wound edge of scratch-wounded and PDGF-stimulated (50 ng/ml) HT1080 cells with either scrambled siRNA (A) or siAKAP220-2 (B). Images shown are from 120-min intervals over 6 h. The dashed line indicates initial wound edge. See also supplemental Movies S4 and S5. C and D, nuclei from individual cells were tracked every 20 min for 4 h using NIH Image J software and the Manual Tracking plug-in for either scramble (C) or siAKAP220 (D). E, quantitation of migration velocity (μm/h) from live-cell imaging of scratch-wounded HT1080 cells with scrambled siRNA (n = 33), siAKAP220-1 (n = 30), and siAKAP220-2 (n = 30) with statistical significance (unpaired two-tailed Student's t test; *** p ≤ 0.001) and S.E. F, immunoblot of IQGAP1 level in HT1080 cells treated with either scramble, siIQGAP1-1, or siIQGAP1-2. Actin serves as loading control. G and H, nuclei from individual cells treated with either control siRNA (G) or siIQGAP1 (H) were tracked every 20 min for 4 h as above. I, quantitation of migration velocity (μm/h) for cells treated with control siRNA (n = 42), siIQGAP1-1 (n = 51), and siIQGAP1-2 (n = 36) with statistical significance (unpaired two-tailed Student's t test; ***, p ≤ 0.001) and S.E. J, immunofluorescent confocal detection of IQGAP1 subcellular location (left panels, gray) in cells expressing GFP control or AKAP220-(1–508)-GFP (middle panels, gray). Composite images are shown for IQGAP1 (red), GFP (green), and nuclei (blue). K, quantitative analysis of IQGAP1 distribution from defined regions at the cell edge and cell center. Ratio of pixel intensity at the cell edge versus the cell interior from cells expressing GFP (n = 10) and AKAP220-(1–508)-GFP (n = 13) is presented with statistical significance (unpaired two-tailed Student's t test; **, p ≤ 0.01) and S.E. L–O, representative migration path (beginning upper left) of a cell expressing either GFP control (L and M) or AKAP220-(1–508)-GFP (N and O). Images shown in L and N are from time 0 through 3 h at 1-h intervals. Images M and O show progressive positions of each cell at the color-coded time points as indicated. P, quantitation of average migration velocity in L and N. Data are shown from GFP (n = 50) and AKAP220-(1–508)-GFP (n = 21) with statistical significance (unpaired two-tailed Student's t test; *, p ≤ 0.05) and S.E. See also supplemental Movies S4–S7.
FIGURE 7.
FIGURE 7.
Model depicting the proposed role of AKAP220 in the control of cell migration. A, AKAP220 and IQGAP1 complexes in unstimulated cells. IQGAP1 is in a ternary complex with calmodulin CaM and Rac near the cell cortex. Anchored GSK-3β phosphorylates CLASP2 to prevent interaction with IQGAP1. B, as intracellular calcium increases, CaM and active Rac are released from IQGAP1, which can now bind to AKAP220. C, as cAMP levels rise, PKA (r, regulatory subunit; C, catalytic subunit) phosphorylates and inhibits GSK-3β, augmenting the CLASP2 interaction with anchored IQGAP1. This promotes microtubule rescue and cell migration.

References

    1. Scott J. D., Pawson T. (2009) Science 326, 1220–1224 - PMC - PubMed
    1. Pidoux G., Taskén K. (2010) J. Mol. Endocrinol. 44, 271–284 - PubMed
    1. Carr D. W., Stofko-Hahn R. E., Fraser I. D., Bishop S. M., Acott T. S., Brennan R. G., Scott J. D. (1991) J. Biol. Chem. 266, 14188–14192 - PubMed
    1. Gold M. G., Lygren B., Dokurno P., Hoshi N., McConnachie G., Taskén K., Carlson C. R., Scott J. D., Barford D. (2006) Mol. Cell 24, 383–395 - PubMed
    1. Kinderman F. S., Kim C., von Daake S., Ma Y., Pham B. Q., Spraggon G., Xuong N. H., Jennings P. A., Taylor S. S. (2006) Mol. Cell 24, 397–408 - PMC - PubMed

Publication types

MeSH terms